

On the day before Valentine’s Day, as Saint Valentine was gearing up to drench the world in red, little did he know that the CPI data from the USA, would turn the tables on gold traders, leaving them seeing red instead, as the USD flexed its muscles, turning the day into a monetary romance of its own!

Source: https://images.app.goo.gl/FfT4jTYzBxk863ZF8
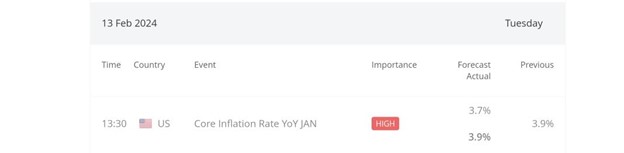
On February 13, the USA revealed its Consumer Price Index (CPI) data, which turned out hotter than expected, boosting the value of the US dollar (USD). CPI measures the change in prices of goods and services bought by consumers. When the actual CPI figure exceeds the forecast, it’s considered positive for the USD.
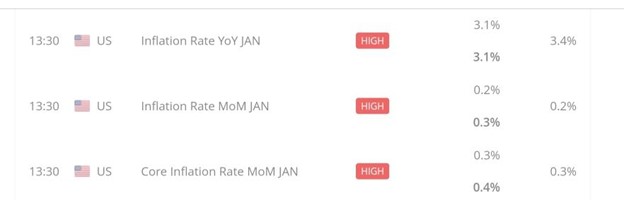
In January, the Core Inflation Rate Year Over Year (YOY) surpassed expectations at 3.9% compared to the forecasted 3.7%, and the Month Over Month (MOM) Core Inflation Rate was 0.4% against the expected 0.3%. Similarly, the Inflation Rate YOY for January matched the forecast at 3.1%, while the MOM Inflation Rate exceeded expectations at 0.3% compared to the forecasted 0.2%. These strong inflation figures bolstered the USD across the board following their release at 13:30 GMT.
Source: https://global.bdswiss.com/economic-calendar/
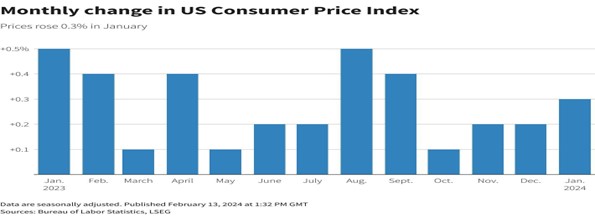
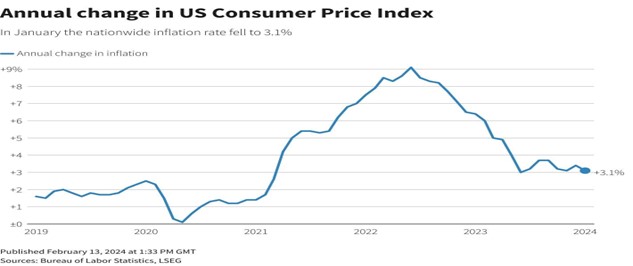
Consumer price growth accelerated, with headline figures rising more than economists predicted. CPI increased by 0.3% from the previous month and 3.1% annually, slightly lower than December’s 3.4%. The core prices, excluding energy and food, maintained a growth rate of 3.9% from the previous year.
The rise was mainly driven by categories like shelter costs and other services, which were expected to ease. Shelter costs, medical care, and transportation services saw significant increases, indicating broad-based inflation across services.
Source: https://bit.ly/49DaYCV
Inflation is slowing, but probably not fast enough to encourage Fed officials to start easing rates soon.
“It’s important not to overreact and jump to the assumption that an inflationary resurgence is developing,” said Seema Shah, chief global strategist at Principal Asset Management. “Inflation was partially driven by segments that are less important for the Fed’s favoured core PCE measure, while forward looking indicators suggest they will ease over the coming months.”
Source: https://bit.ly/49DaYCV
Source: https://bit.ly/49DaYCV
From a technical standpoint, analyzing the XAUUSD (gold to USD) daily timeframe, an upward trendline has been in place since October 6, 2023, starting at $1810.71. This trendline prevented a price reversal at $1974.25 after reaching its all-time high of $2145.37 on December 4, 2023. The price continued its upward trajectory after bouncing off the trendline, reaching $2088.30.
However, the XAUUSD price reversed again, breaking the uptrend line on January 16, 2024, suggesting a higher probability of the price declining.
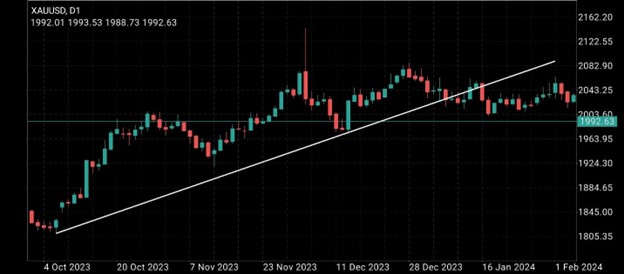
Source : Metatrader 4 , XAUUSD Daily Chart
On the 4-hour timeframe, the price has been fluctuating between $2065.00 as resistance and $2001.59 as support. Currently, the price stands around $1992.42, indicating that the support level has been breached, increasing the likelihood of further decline in XAUUSD price. If the price reverses back into the range, there’s a higher chance of it reaching the resistance at $2065.00.
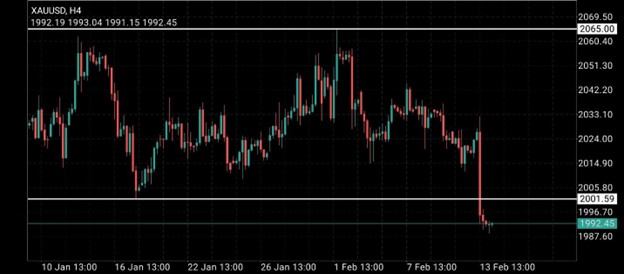
Source : Metatrader 4 , XAUUSD 4HR Chart


