

Previous Trading Day’s Events (26.06.2024)
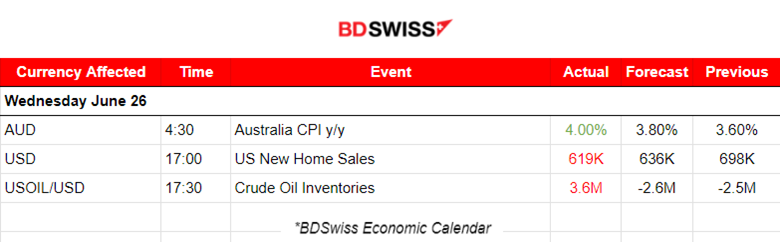
The consumer price index (CPI) rose at an annual pace of 4.0% in May, up from 3.6% in April and well above market forecasts of 3.8%.
A closely watched measure of core inflation, the trimmed mean, climbed to an annual 4.4%, also its highest level in six months and up from 4.1%.
Markets moved to imply a 60% chance of a quarter-point hike from the Reserve Bank of Australia by November.
George Tharenou, chief economist at UBS, expects the second quarter CPI to come in at a quarterly rate of 1.1%, above the RBA’s own forecasts.
“Our new CPI forecasts make a rate hike in August a ‘close call’… However, we see enough evidence to change our base case view,” said Tharenou, adding that there is also a risk of a follow-up hike most likely in November.
______________________________________________________________________
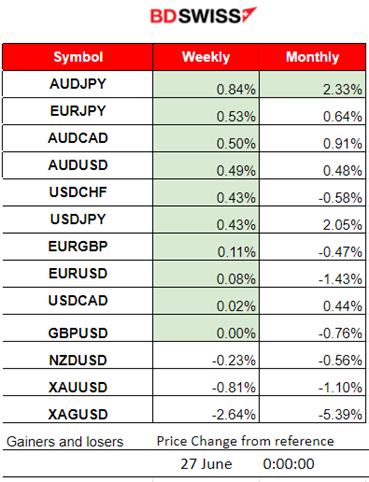
Winners vs Losers
AUD continues to thrive this week. AUDJPY is performing well with 0.84% gains this week and is leading with 2.33% gains this month. Metals got to the bottom.
 ______________________________________________________________________
News Reports Monitor – Previous Trading Day (26.06.2024)
Server Time / Timezone EEST (UTC+03:00)
- Midnight – Night Session (Asian)
In Australia, inflation was reported higher than expected. The monthly CPI indicator rose 4.0% in the 12 months to May, up from a 3.6% rise in the 12 months to April. The RBA has kept interest rates elevated but inflation refuses to cool down causing the AUD to appreciate. At the time of the release, the AUD jumped more than 30 pips and retracement has not taken place yet.
- Morning – Day Session (European and N. American Session)
The New Home Sales figure was released at 17:00 showing that new home sales plunged unexpectedly last month. They dropped to 619K from 698K. That was the steepest monthly decline since September 2022 and marks the lowest level since November. The impact on the market was minimal though.
At 17:30, crude oil inventory figures were reported to be 3.6M, a surprise since a negative figure was expected instead. A notable price drop was observed at the time of the release but the effect was soon reverted. The price of crude oil remained on a sideways path.
General Verdict:
 __________________________________________________________________
FOREX MARKETS MONITOR
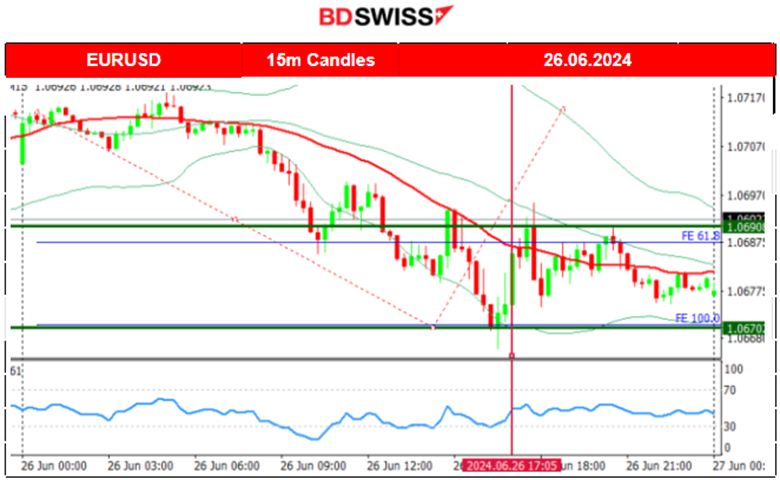
EURUSD (26.06.2024) 15m Chart Summary
Server Time / Timezone EEST (UTC+03:00)
Price Movement
The pair moved steadily downwards early, driven by USD appreciation. Moderate volatility was observed even with the absence of important releases. The New Homes figure release did not have much impact on the USD. After reaching support near 1.067, the pair retraced to the 30-period MA and remained close to it, moving sideways until the rest of the trading day.
 ___________________________________________________________________
CRYPTO MARKETS MONITOR
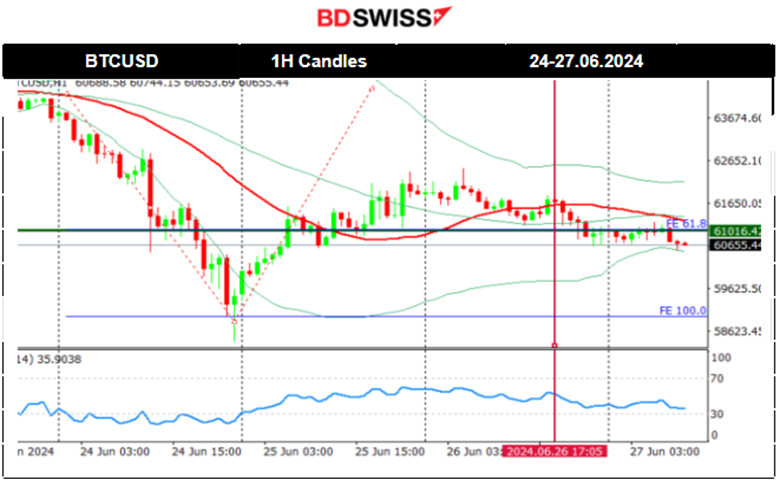
BTCUSD (Bitcoin) Chart Summary 1H
Server Time / Timezone EEST (UTC+03:00)
Price Movement
On the 20th, the price moved to the upside breaking the upper band of a triangle formation and stalled at 65,500 USD. That changed on the 21st when the price moved lower quite aggressively, reaching the support at 63,430 USD before retracing and settling to 64K USD. During the weekend, volatility lowered but yesterday, 24th of June, Monday, Bitcoin plunged to 58,400 before retracing to the 61.8 Fibo level and settling near the 30-period MA, very close to 61K USD for now. Not too much volatility currently as the price is moving around the MA, and the price is leaning more towards the downside.
 Crypto sorted by Highest Market Cap:
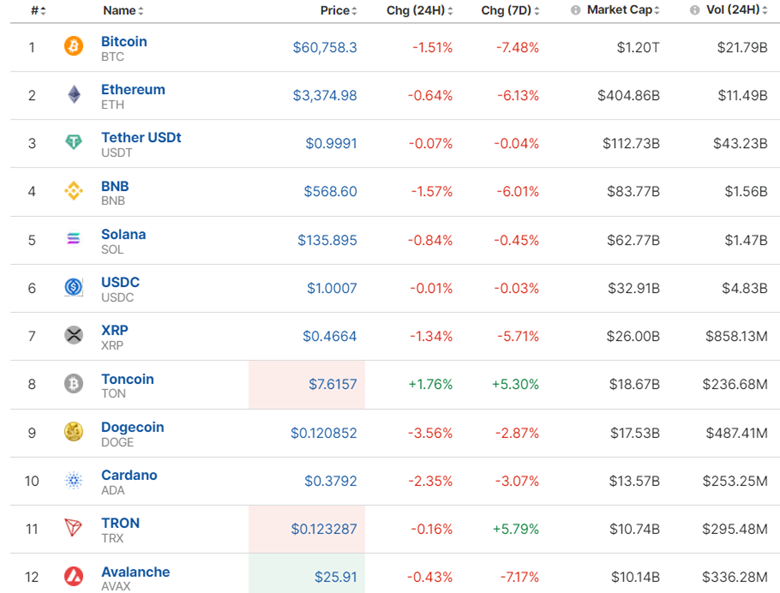
The Crypto Market is still suffering. Bitcoin remains low close to 60K USD. Volatility lowered as we approached the end of the week.
https://www.investing.com/crypto/currencies
______________________________________________________________________
EQUITY MARKETS MONITOR
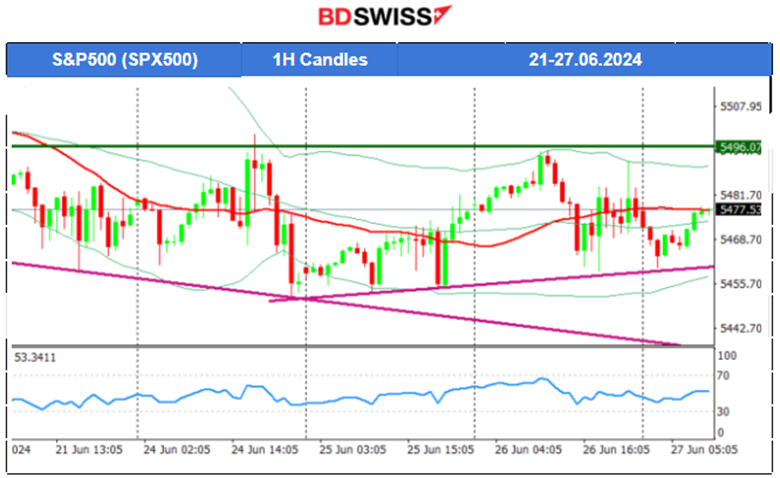
S&P500 (SPX500) 4-Day Chart Summary
Server Time / Timezone EEST (UTC+03:00)
Price Movement
On the 20th, the wedge was broken to the downside and the index dropped rapidly to the support near 5,456 USD. Retracement followed. The 30-period MA confirmed a turning point to the downside and a downward trend formed. The price was following a downward wedge actually as it seems. Interest rates in the U.S. are expected to remain high and stocks see a drawdown while the rising price of oil increases costs further. As mentioned in our previous analysis, the RSI provided bullish signals and the index after unsuccessfully testing the support near 5,453 USD, eventually moved higher. On the 26th, the index tested the resistance near 5,496 without success and retraced to the MA continuing the path sideways. No clear direction forecast for now until we see some breakouts.
 ______________________________________________________________________
COMMODITIES MARKETS MONITOR
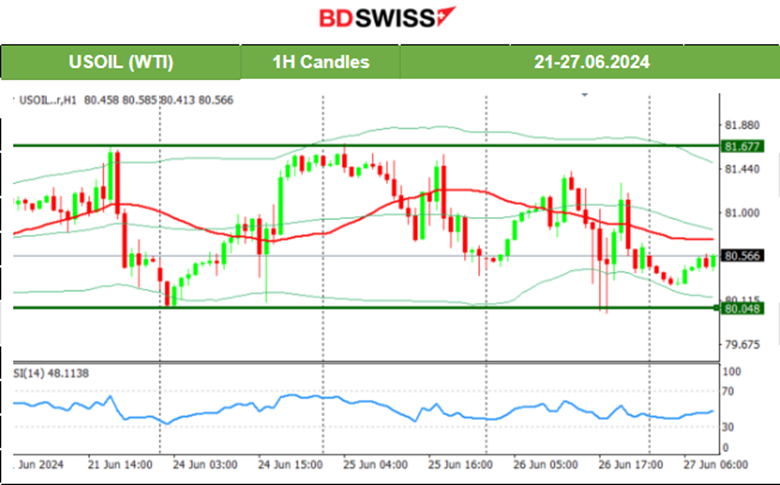
USOIL (WTI) 4-Day Chart Summary
Server Time / Timezone EEST (UTC+03:00)
Price Movement
The price eventually broke the 81 USD/b level on the 20th and it remains high. On the 21st the price experienced a drop after 18:00 by 1.30 USD/b but during the next couple of days, it reversed to the upside. The resistance area remains strong at 81.7 USd/b. It is clear from the chart that the 80 USD/b acts as a support now. Currently, despite the volatility, there is a sideways movement with high deviations from the mean. However, there was no breakout yet of the important support and resistance areas that were mentioned. On the 26th the price tested the support near 80 USD/b without success and retraced back to the MA. We have currently a max near 1 USD deviation from the mean.
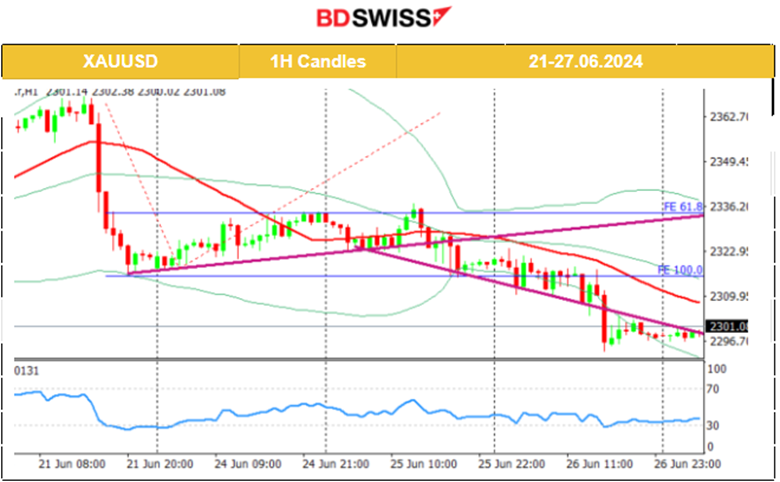
 XAUUSD (Gold) 4-Day Chart Summary
Server Time / Timezone EEST (UTC+03:00)
Price Movement
The resistance broke on the 20th of June with Metals in general experiencing a rise in prices despite the dollar strengthening. The 2,350 USD/oz was reached as per our previous analysis with gold not losing momentum and reaching even higher at nearly 2,365 USD/oz on the 20th. A triangle formation was visible with the RSI showing bearish signals. That triangle was broken to the downside on the 21st a few minutes before the release of the U.S. PMIs. Gold dived nearly 50 USD before retracing to the 61.8 Fibo level and returning back to the 30-period MA. On the 25th, the price dropped after breaking a triangle formation and moved lower, remaining below the 30-period MA. The trend eventually continued and Gold moved to the downside. USD appreciation helped. On the 26th the price broke important support levels and moved lower rapidly to 2,293 USD/oz before retracement took place. Currently, it is settled at 2,300 USD/oz.
 ______________________________________________________________
News Reports Monitor – Today Trading Day (27.06.2024)
Server Time / Timezone EEST (UTC+03:00)
- Midnight – Night Session (Asian)
No important news announcements, no important scheduled releases.
- Morning – Day Session (European and N. American Session)
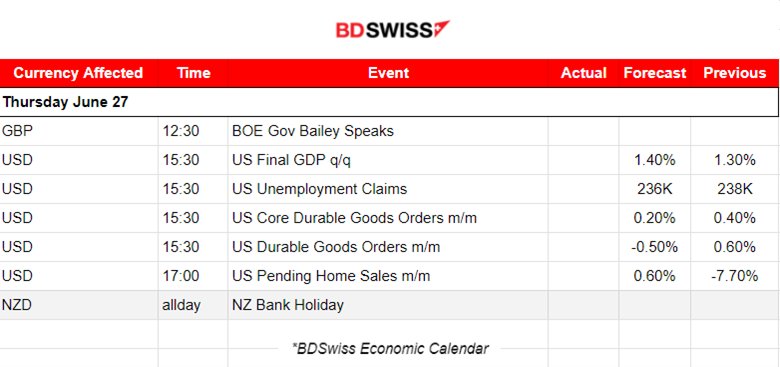
The pound reversed from yesterday’s depreciation and today we have the BOE governor shaking the markets at 12:30. Is the BOE moving towards a cut? This is the big question. Central Banks are experiencing already high inflation actually and that is concerning. Check BOC and RBA. The Bank of England kept rates at 5.25% ahead of a July 4th election. Interesting will be the statements of the head of the central bank and GBP could see volatility generating trading opportunities
At 15:30 important news for the U.S. is potentially going to shake the markets and USD pairs. Final GDP for the quarter, Unemployment claims, and durable goods orders figures will be released at the same time. Despite the expectations for declines the USD might only be affected negatively at the time of the releases. In the medium-term, it could see appreciation again due to elevated interest rates and high inflation expectations.
Pending home sales could increase volatility at 17:30 but no major shock is expected to take place at that time.
General Verdict:
______________________________________________________________


