

PREVIOUS TRADING DAY EVENTS – 19 Sep 2023
“We have got to avoid overly strident opinions that the bank is done with rate hikes and be more circumspect, follow the evidence,” said Derek Holt, vice president of capital markets economics at Scotiabank. “I still think we need to leave the door very much open to further rate hikes, plural.”
Bank of Canada Deputy Governor Sharon Kozicki: “Underlying inflation is still well above the level that would be consistent with achieving our target of 2% CPI inflation,” she said.
Bank of Canada Governor Tiff Macklem, noting an increase in oil prices, on Sept. 7 predicted that “headline inflation is going to go up in the near term before it eases.”
The central bank held its key overnight interest rate at 5% on September 6th but said it could raise borrowing costs again should inflationary pressures persist.
______________________________________________________________________
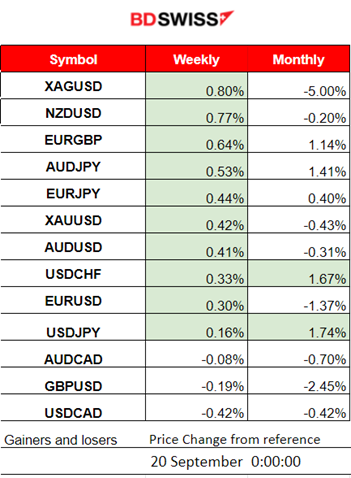
Winners vs Losers
______________________________________________________________________
News Reports Monitor – Previous Trading Day (19 Sep 2023)
Server Time / Timezone EEST (UTC+03:00)
- Midnight – Night Session (Asian)
“Members commenced their discussion of the global economy by observing that headline inflation had continued to ease in year-ended terms in most economies because food and energy commodity prices were generally lower than they had been a year earlier. More recent increases in some food and energy prices presented upside risks to headline inflation in the months ahead. Nevertheless, many central banks in advanced economies expected inflation to moderate further and return to target during 2025.”
https://www.rba.gov.au/monetary-policy/rba-board-minutes/2023/2023-09-05.html
The RBA considered a rate hike but decided to pause instead. It is determined to return the inflation rate to the target within a reasonable time period.
- Morning–Day Session (European and N. American Session)
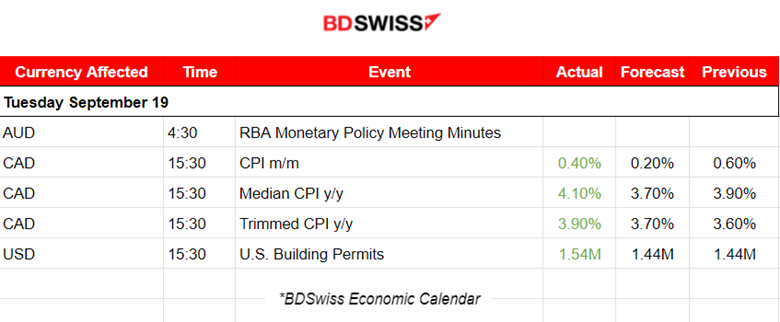
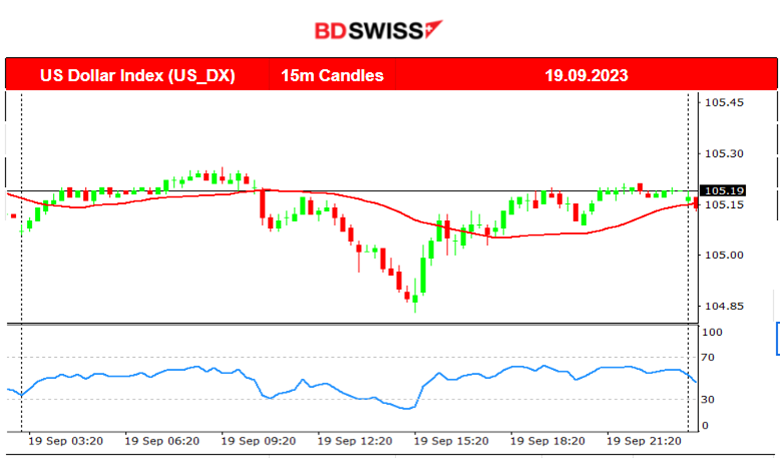
The news at 15:30 caused the CAD to appreciate giving it a little push to the upside for a while but soon the effect faded. CAD was actually gaining strength early yesterday against other currencies since the European Session started. The retracement that took place later, after the CPI reports came out, was inevitable. The U.S. dollar experienced some appreciation after the U.S. Building Permits figure which was way higher than expected. This is reflected also in the DXY chart below.
General Verdict:
____________________________________________________________________
FOREX MARKETS MONITOR
EURUSD (19.09.2023) Chart Summary
Server Time / Timezone EEST (UTC+03:00)
Price Movement
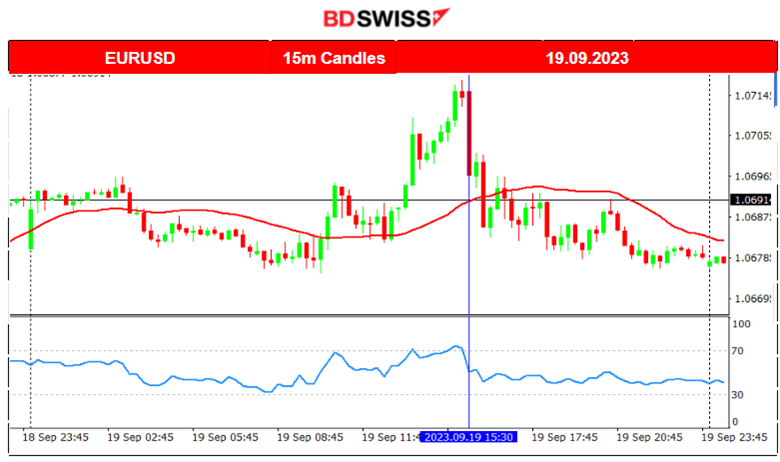
The pair experienced low volatility in general and this resulted in the pair moving sideways and around the MA overall. After the European session started, the USD experienced depreciation that ended at 15:30 as the chart shows. This caused the EURUSD to move to the upside and find resistance near 1.07180 before it retraced to the mean.
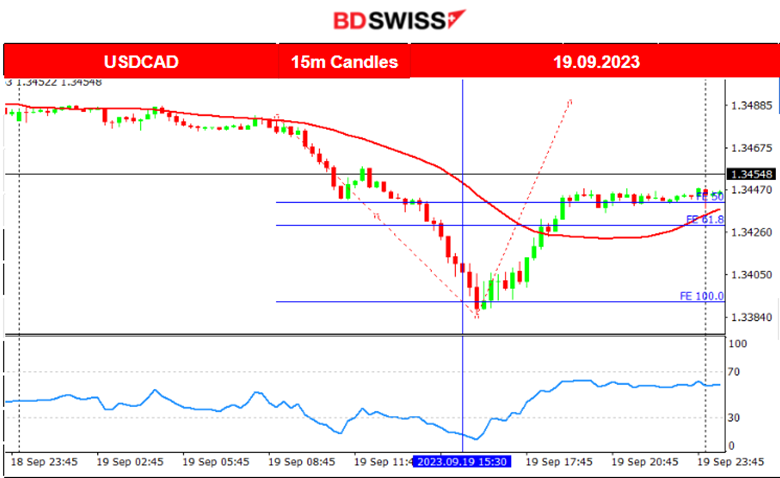
USDCAD (19.09.2023) Chart Summary
Server Time / Timezone EEST (UTC+03:00)
Price Movement
The pair started early to show signs of CAD appreciation and that is the reason why it dropped after the European Session started. It was a relatively rapid fall that was enhanced further by the news at 15:30. After the higher-than-expected CPI change release, it soon found support at near 1.33850 before retracing eventually back to the 30-period MA.
___________________________________________________________________
CRYPTO MARKETS MONITOR
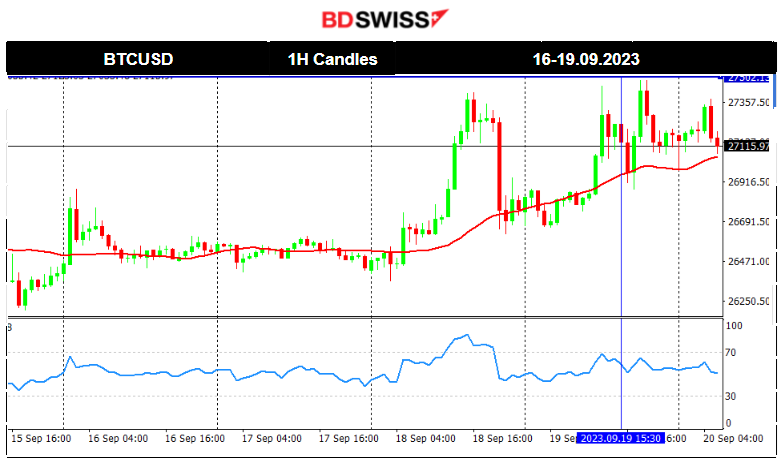
BTCUSD (Bitcoin) 4-Day Chart Summary
Server Time / Timezone EEST (UTC+03:00)
Price Movement
Bitcoin remains high ahead of the FOMC. It remains above the 30-period MA and after the release at 21:00, the decision on the Fed rate might change everything. Unchanged could mean USD weakening causing Bitcoin to climb.
Crypto sorted by Highest Market Cap:
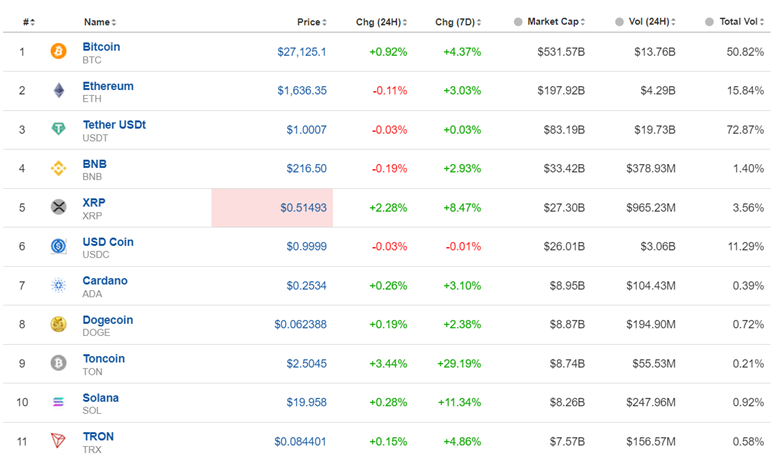
The last 7 days look good for Crypto. The general path is upside.
Source: https://www.investing.com/crypto/currencies
______________________________________________________________________
EQUITY MARKETS MONITOR
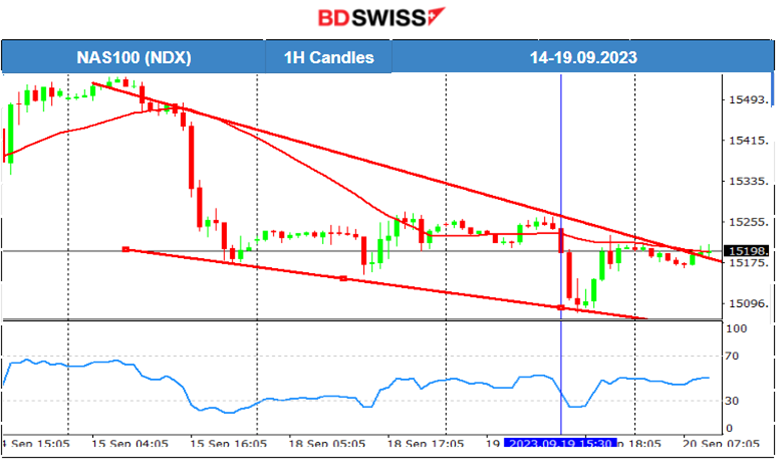
NAS100 (NDX) 4-Day Chart Summary
Server Time / Timezone EEST (UTC+03:00)
Price Movement
All the benchmark indices suffered a downfall, in general, these last few days but high volatility. The market is quite volatile for stocks. Businesses see high costs as U.S. oil is moving higher and higher, inflation is still moving upward according to the latest report and a risk-off mood is probably dominating the market. Yesterday all indices experienced a drop after 15:30, at that time the U.S. Building Permits’s figure was reported higher than expected and the USD appreciated. Indices soon retraced after that and settled to their mean price.
______________________________________________________________________
COMMODITIES MARKETS MONITOR
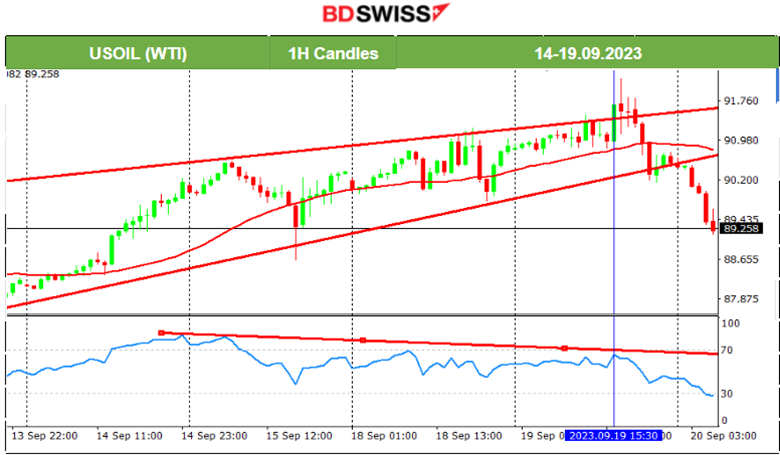
USOIL (WTI) 4-Day Chart Summary
Server Time / Timezone EEST (UTC+03:00)
Price Movement
Crude price has been following a long-lasting upward trend and it went over 90 USD/b. It remained above the 30-period MA for some time. An ascending triangle was formed and this was broken yesterday causing the price to move significantly to the downside justifying the indication of a bearish divergence that was mentioned in our previous report.
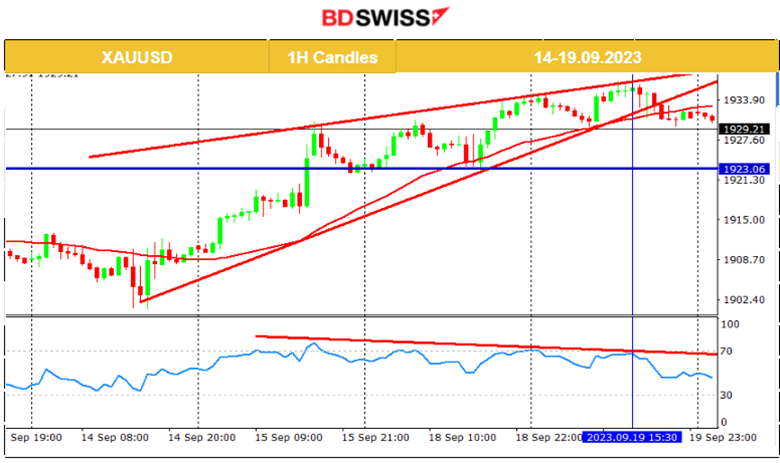
XAUUSD (Gold) 4-Day Chart Summary
Server Time / Timezone EEST (UTC+03:00)
Price Movement
Gold started to move significantly upwards since the 14th, reversing and crossing the 30-period MA as it went upwards. Technically, the RSI was showing lower highs indicating a bearish divergence that eventually seems to hold. The price slowed down and even broke the ascending triangle that was formed. It might move downwards towards the support near 1923. However, caution should be taken since at 21:00 today the FOMC release could cause too much uncertainty and unpredictable moves creating a distortion of the technicals.
______________________________________________________________
News Reports Monitor – Today Trading Day (20 Sep 2023)
Server Time / Timezone EEST (UTC+03:00)
- Midnight – Night Session (Asian)
No important news announcements, no special scheduled releases.
- Morning–Day Session (European and N. American Session)
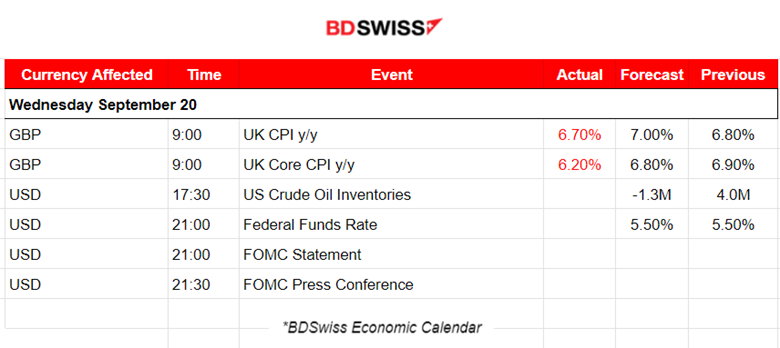
The inflation-related figures for the U.K. caused a shock at 9:00. Inflation dropped, quite the opposite of what was expected, in regards to the yearly calculation at least. 6.70% is low and it is the second consecutive fall. On a monthly basis, CPI rose by 0.3% in August 2023, compared with a rise of 0.5% in August 2022. The GBP depreciated heavily after the shock. GBPUSD fell to near 50 pips.
The next release is the Crude oil inventories at 17:30. This summer, the reported changes were negative mostly and in high numbers, indicating a steady demand and a shortage in supply. The report on August 30th showed a figure of -10.6M after a -6M figure appearing twice that month in the reports. The price of Crude oil has reached 90 USD/barrel recently after a long trend that was observed during August.
The most important release takes place at 21:00. The Fed is going to decide if they are pausing the hikes for now. With inflationary pressures still giving the policymakers a hard time we might see a surprise after all. The chance is small though since they have been building the market’s expectations for some time now by declaring a pause. A surprise would clearly create a tremendous shock and uncertainty. Waiting for the FOMC statement and the press conference that takes place 30 minutes after the release.
General Verdict:
______________________________________________________________


