In this Analysis, we will delve into the Daily (D) timeframe to gain a comprehensive view of the current state of XAUUSD, USOIL, GBPUSD, EURUSD and BTCUSD for Today, 14th February, 2024.
Additionally, we will briefly touch on a fundamental factor influencing its price.
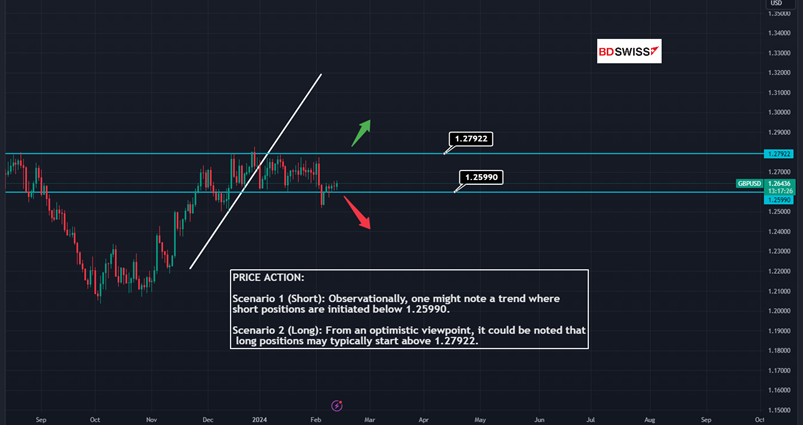
GBPUSD TECHNICAL ANALYSIS: FEBRUARY 14TH, 2024
PRICE ACTION:
Scenario 1 (Short): Observationally, one might note a trend where short positions are initiated below 1.25990.
Scenario 2 (Long): From an optimistic viewpoint, it could be noted that long positions may typically start above 1.27922.
Quick Fundamental:
The UK’s Office for National Statistics (ONS) released data on Wednesday indicating that the inflation rate, as tracked by the Consumer Price Index (CPI), remained unchanged at 4% in January. The CPI experienced a monthly decrease of 0.6%. Following the release of this information, the Pound Sterling faced downward pressure, with the GBPUSD pair trading in the red, falling below the 1.2600 mark.
GBPUSD DAILY CHART:
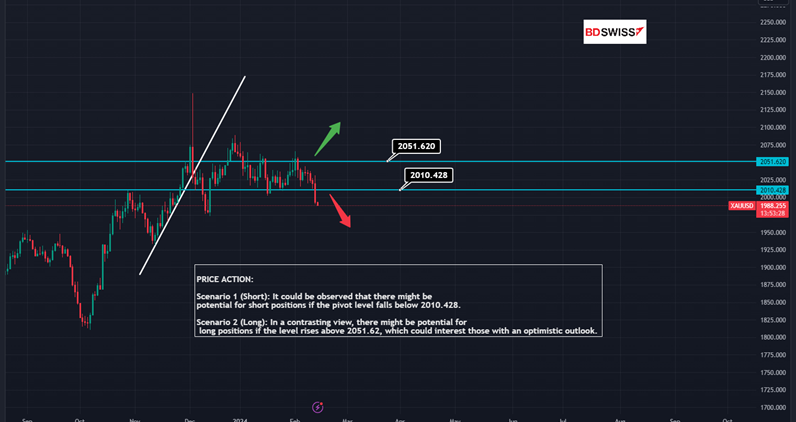
XAUUSD TECHNICAL ANALYSIS: FEBRUARY 14TH, 2024
PRICE ACTION:
Scenario 1 (Short): It could be observed that there might be potential for short positions if the pivot level falls below $2010.428.
Scenario 2 (Long): In a contrasting view, there might be potential for long positions if the level rises above $2051.62, which could interest those with an optimistic outlook.
Quick Fundamental:
Gold prices declined, falling below the $2,000 mark for the first time this year, in response to a surge in US yields following the release of US inflation figures. The XAUUSD pair remains under pressure and is currently trading at approximately $1,990 as of mid-week.
XAUUSD DAILY CHART:
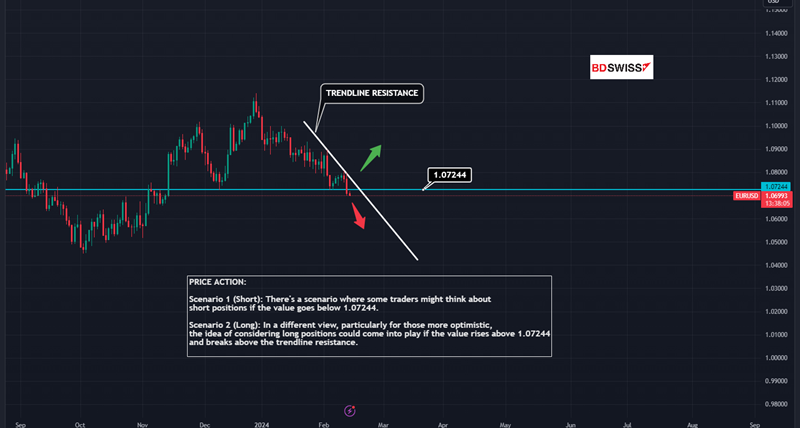
EURUSD TECHNICAL ANALYSIS: FEBRUARY 14TH, 2024
PRICE ACTION:
Scenario 1 (Short): There’s a scenario where some traders might think about
short positions if the value goes below 1.07244.
Scenario 2 (Long): In a different view, particularly for those more optimistic,
The idea of considering long positions could come into play if the value rises above 1.07244 and breaks above the trendline resistance.
Quick Fundamental:
The EURUSD pair faced downward pressure during Tuesday’s second half, reaching its three-month low near 1.0700. Currently, it is in a consolidation phase, trading marginally above this level in the early hours of Wednesday’s European session.
EURUSD DAILY CHART:
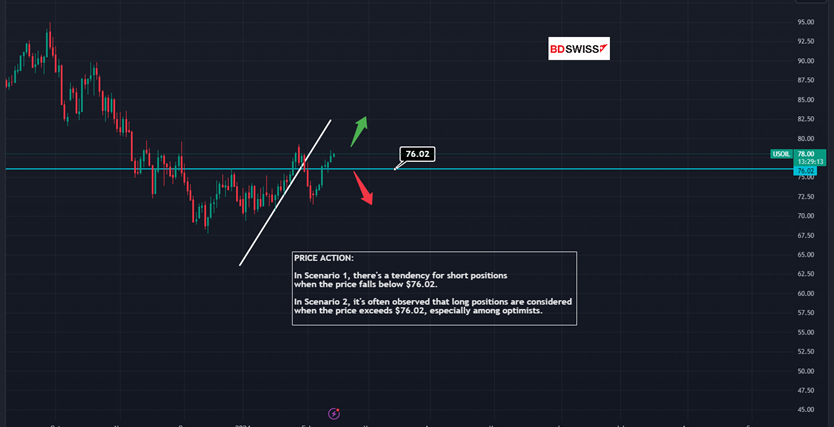
PRICE ACTION:
In Scenario 1, there’s a tendency for short positions
when the price falls below $76.02.
In Scenario 2, it’s often observed that long positions are considered
when the price exceeds $76.02, especially among optimists.
Quick Fundamental:
USOIL crude oil prices continued their upward trend, with the price hovering around $77.50 per barrel during Wednesday’s Asian trading session. Despite encountering obstacles, crude oil prices have bounced back from earlier losses within the day.
Analysts at ANZ have linked the temporary dip in oil prices to concerns over supply from Organization of the Petroleum Exporting Countries (OPEC) members. OPEC’s latest monthly report highlighted apprehensions regarding the group’s compliance with recent production reductions. Among the members, only Kuwait and Algeria have fully adhered to their allocated cuts, while Iraq’s production significantly exceeds its agreed-upon limit.
USOIL DAILY CHART:
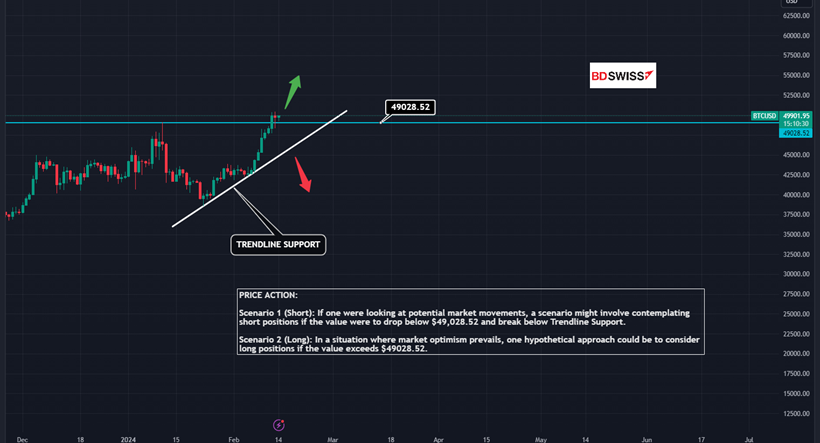
BTCUSD (BITCOIN) TECHNICAL ANALYSIS: FEBRUARY 14TH, 2024
PRICE ACTION:
Scenario 1 (Short): If one were looking at potential market movements, a scenario might involve contemplating short positions if the value were to drop below $49,028.52 and break below Trendline Support.
Scenario 2 (Long): In a situation where market optimism prevails, one hypothetical approach could be to consider long positions if the value exceeds $49,028.52.
Quick Fundamental:
Wall Street is making significant Bitcoin purchases, with a notable increase following the historic US approval of spot Bitcoin exchange-traded funds (ETFs) on January 10. Data suggests that Wall Street might be acquiring Bitcoin in large quantities, with daily purchases exceeding the network’s production capacity by more than twelvefold.
BTCUSD DAILY CHART: