In this Analysis, we will delve into the Daily(D) timeframe to gain a comprehensive view of the current state of XAUUSD, USOIL, GBPUSD, EURUSD and BTCUSD as at Today, 22nd January, 2024.
Additionally, we will briefly touch on a fundamental factor influencing its price.
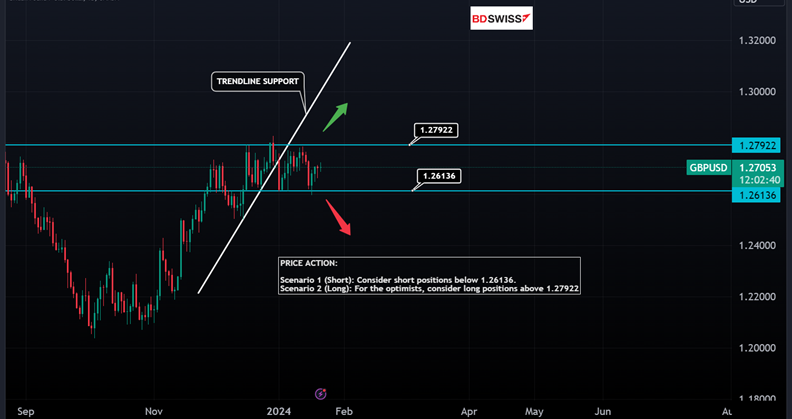
GBPUSD TECHNICAL ANALYSIS: JANUARY 22ND, 2024
MOOD SWING : No significant Price movement from the analysis last week. Price remains below Trendline Support and consolidating between 1.26136 & 1.27922
PRICE ACTION:
Scenario 1 (Short): Observationally, one might note a trend where short positions are initiated below 1.26136.
Scenario 2 (Long): From an optimistic viewpoint, it could be noted that long positions may typically start above 1.27922.
Quick Fundamental:
Following a week of slight losses, the GBPUSD currency pair appears to be stabilizing around the 1.2700 mark as of Monday. The upcoming release of Services and Manufacturing PMIs on Wednesday is anticipated to be the next significant set of data from the UK.
GBPUSD DAILY CHART: XAUUSD TECHNICAL ANALYSIS: JANUARY 22ND, 2024
PRICE ACTION:
Scenario 1 (Short): It could be observed that there might be potential for short positions if the pivot level falls below 2014.298.
Scenario 2 (Long): In a contrasting view, there might be potential for long positions if the level rises above 2051.62, which could interest those with an optimistic outlook.
Quick Fundamental:
Despite rebounding on Thursday and Friday, gold experienced a nearly 1% decline over the past week. On Monday morning, XAUUSD remained under pressure, last observed with a loss of roughly 0.5% for the day, trading at approximately 2020.
XAUUSD DAILY CHART: EURUSD TECHNICAL ANALYSIS: JANUARY 22ND, 2024
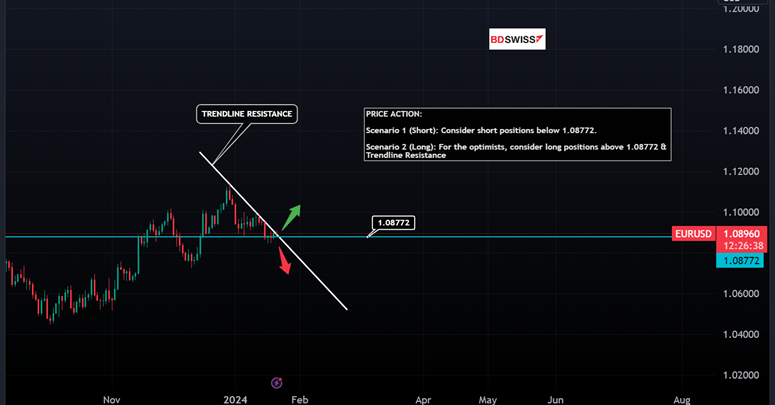
MOOD SWING : Minor Downtrend, Price below Trendline Resistance. Will price breakout of the trend or continue to dip below 1.08772 ?
PRICE ACTION:
Scenario 1 (Short): There’s a scenario where some traders might think about short positions if the value goes below 1.08772.
Scenario 2 (Long): In a different view, particularly for those more optimistic, the idea of considering long positions could come into play if the value rises above 1.08772 and approaches the trendline resistance.
Quick Fundamental:
Due to the widespread strength of the US Dollar, the EURUSD pair ended last week on a down note. At the World Economic Forum in Davos on Friday, the President of the European Central Bank (ECB), Christine Lagarde, chose not to discuss immediate monetary policy prospects. However, she observed that inflation rates were declining both in the Eurozone and globally. As of early Monday, the currency pair remained stable, hovering around the 1.0900 mark.
EURUSD DAILY CHART: MOOD SWING : No significant Price movement from last week’s analysis. Consolidation between pivot levels $75.31 & $68.90
PRICE ACTION:
In Scenario 1, there’s a tendency for short positions when the price falls below $68.90.
In Scenario 2, it’s often observed that long positions are considered when the price exceeds $75.31, especially among optimists.
Quick Fundamental:
Oil prices, specifically West Texas Intermediate (WTI) US Crude Oil, are experiencing slight declines, hovering near the $73.00 per barrel level. This marks the second consecutive day of a downward trend, observed during the Asian trading session on Monday. Despite this, the oil prices have remained within a consistent trading range that has persisted for about the last three weeks. This stability is due to a mix of various market indicators, suggesting that traders should exercise caution before making any significant directional investments.
USOIL DAILY CHART: BTCUSD (BITCOIN) TECHNICAL ANALYSIS: JANUARY 22ND, 2024
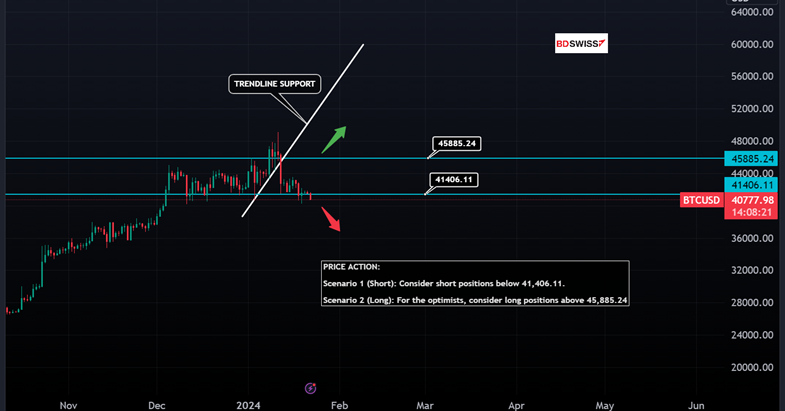
MOOD SWING : Bearish Pressure, Price below Trendline Support.
PRICE ACTION:
Scenario 1 (Short): If one were looking at potential market movements, a scenario might involve contemplating short positions if the value were to drop below $41,406.11.
Scenario 2 (Long): In a situation where market optimism prevails, one hypothetical approach could be to consider long positions if the value exceeds $45,885.24.
Quick Fundamental:
On Monday morning, Bitcoin (BTC) is facing challenges in maintaining stability, with its value hovering around $41,000. This comes after a recent drop in its price. The decrease in investment interest from major holders, commonly referred to as ‘whales’, along with a rise in their holdings of Tether (USDT) on the Bitfinex platform, indicates a potential continuation of the downward trend in Bitcoin’s price in the near future.
BTCUSD DAILY CHART:


