In this Analysis, we will delve into the Daily (D) timeframe to gain a comprehensive view of the current state of EURUSD, XAUUSD, GBPUSD, USOIL, & BTCUSD for Today, 27th March, 2024.
Additionally, we will briefly touch on a fundamental factor influencing its price.
EURUSD TECHNICAL ANALYSIS: 27th MARCH , 2024
PRICE ACTION:
Scenario 1 (Short): There’s a scenario where some traders might think about short positions if the value stays below 1.08357
Scenario 2 (Long): In a different view, particularly for those more optimistic, The idea of considering long positions could come into play if the value breaks above 1.08357 and Trendline Resistance
Quick Fundamental:
During Tuesday’s American session, EURUSD lost momentum and fell below 1.0850, ultimately closing the day nearly unchanged. In the early European session, the pair fluctuated within a tight range above 1.0825.
EURUSD DAILY CHART: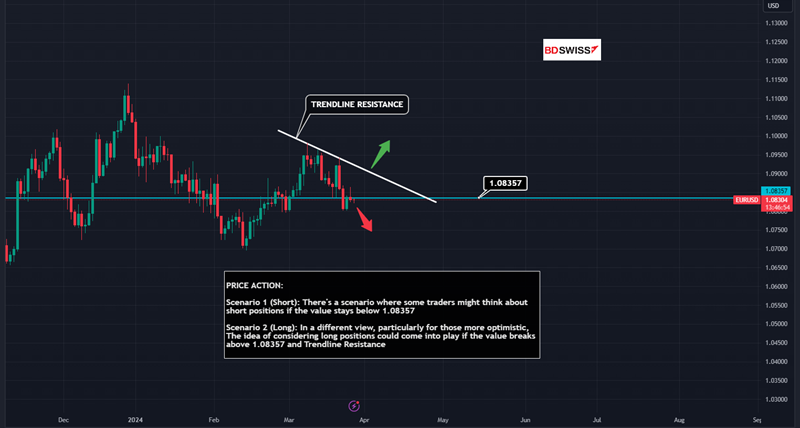 XAUUSD TECHNICAL ANALYSIS: 27th MARCH, 2024
PRICE ACTION:
Scenario 1 (Short): It could be observed that there might be potential for short positions if the price breaks below $2148.014
Scenario 2 (Long): In a contrasting view, there might be potential for long positions if the price breaks above $2194.206 which could interest those with an optimistic outlook.
Quick Fundamental: Gold reversed its course following a brief touch of $2,200 on Tuesday, subsequently dipping below $2,180. As of early Wednesday, XAUUSD remains in a consolidation phase.
XAUUSD DAILY CHART: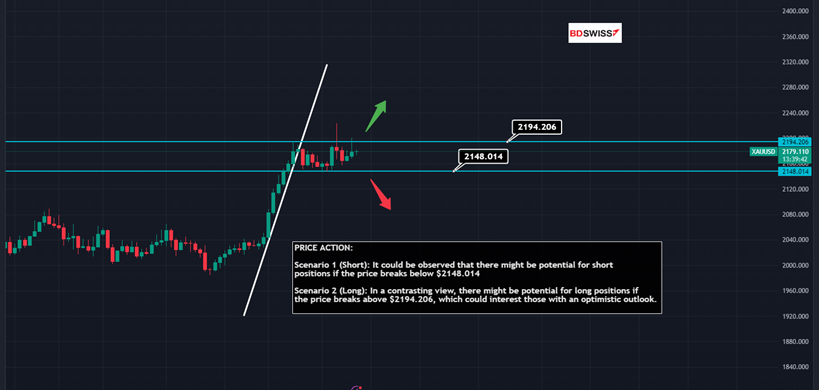 GBPUSD TECHNICAL ANALYSIS: 27th MARCH, 2024
PRICE ACTION:
Scenario 1 (Short): Observationally, one might note a trend where short positions are initiated if price remains below 1.26698
Scenario 2 (Long): From an optimistic viewpoint, it could be noted that long positions may typically start if price breaks above 1.26698 and Trendline Resistance
Quick Fundamental: The GBPUSD struggled to maintain its upward momentum on Tuesday, ultimately closing in negative territory. Early on Wednesday, the pair remained under pressure, drifting lower towards the 1.2600 level. Later in the session, the Bank of England is scheduled to release the Financial Policy Committee statement.
GBPUSD DAILY CHART: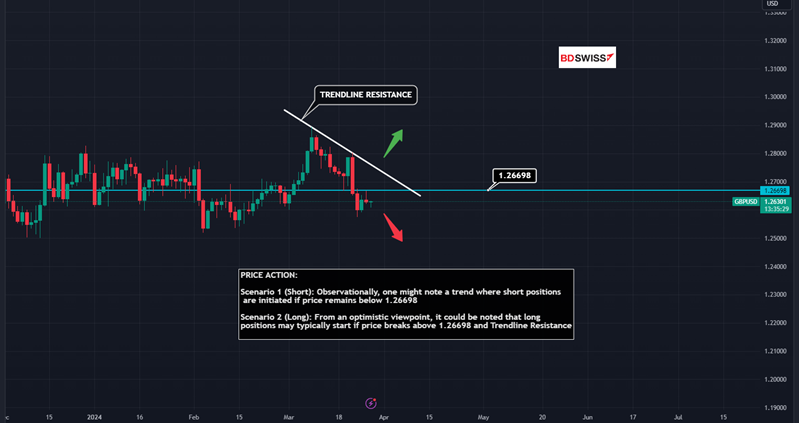 USOIL(WTI) TECHNICAL ANALYSIS: 27th MARCH, 2024
PRICE ACTION:
In Scenario 1, there’s a tendency for short positions when the price stays below $81.55
In Scenario 2, it’s often observed that long positions are considered when if price breaks above $81.55, especially among optimists.
Quick Fundamental: On Wednesday, Western Texas Intermediate (WTI), the US crude oil benchmark, is trading around $80.85. Prices dipped slightly due to a modest rebound in the US Dollar (USD) and mixed reactions to Russian refinery disruptions caused by recent Ukrainian attacks. Concerns arose over global oil supply as these disruptions affected around 12% of Russia’s total oil processing capacity. Geopolitical tensions, especially in the Middle East and Russia-Ukraine, are anticipated to influence WTI prices positively. Additionally, the Organisation of Petroleum Exporting Countries and its allies (OPEC+) are expected to maintain production cuts amidst escalating tensions, typically leading to price increases when supply is reduced.
USOIL DAILY CHART: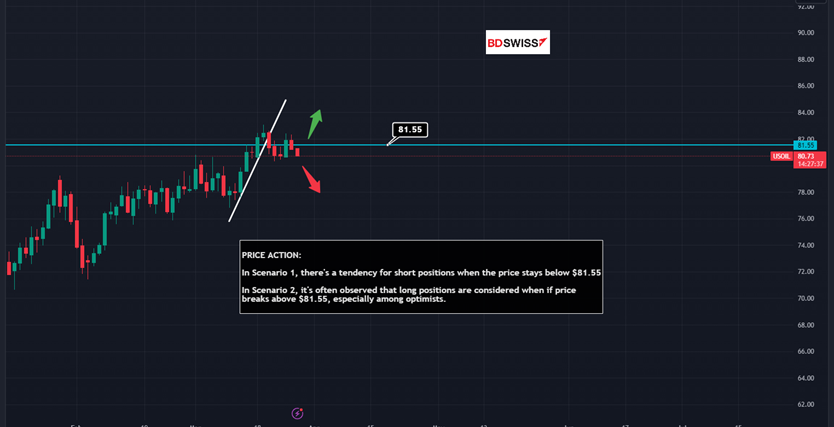 BTCUSD (BITCOIN) TECHNICAL ANALYSIS: 27th MARCH, 2024
PRICE ACTION:
Scenario 1 (Short): If one were looking at potential market movements, a scenario might involve contemplating short positions if the value were to stay below $64,656.20 and Trendline Resistance.
Scenario 2 (Long): In a situation where market optimism prevails, one hypothetical approach could be to consider long positions if the value stays above $64,656.20
Quick Fundamental: Bitcoin’s price reached $71,561 on Binance but fell short of its March peak at $73,777. Long-term holders are selling more amidst rising profits, creating a dilemma for traders balancing short-term gains and sustainability. BTC rebounded above $70,000, driven by outflows from spot BTC ETFs. Reports, last week of the London Stock Exchange considering Bitcoin and Ethereum ETNs buoyed the market, yet sustained upward movement is challenged by profit-taking among long-term holders.
BTCUSD DAILY CHART: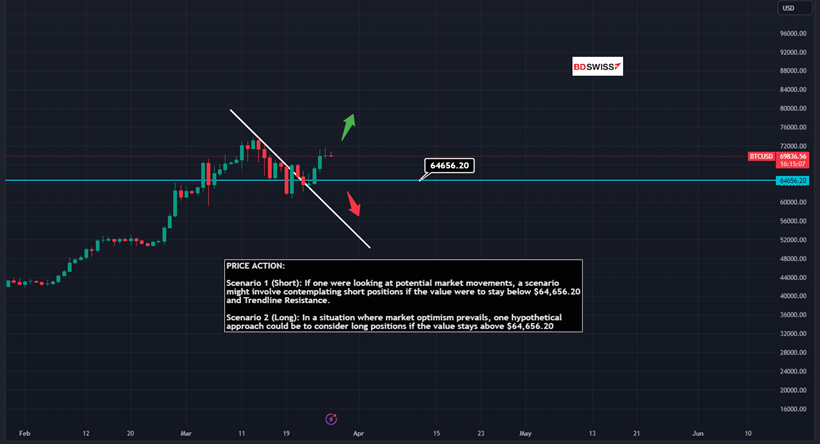 SOURCE : FXSTREET.COM | TRADINGVIEW.COM


