

In this Analysis, we will delve into the Daily (D) timeframe to gain a comprehensive view of the current state of EURUSD, XAUUSD, GBPUSD, USOIL, & BTCUSD for Today, 20th March, 2024.
Additionally, we will briefly touch on a fundamental factor influencing its price.
EURUSD TECHNICAL ANALYSIS: 20th MARCH , 2024
PRICE ACTION:
Scenario 1 (Short): There’s a scenario where some traders might think about
short positions if the value stays below 1.08882 and Trendline Support
Scenario 2 (Long): In a different view, particularly for those more optimistic,
The idea of considering long positions could come into play if the value breaks above 1.08882
Quick Fundamental:
EURUSD recovered from its earlier decline below 1.0850 to end the day nearly unchanged on Tuesday. The economic agenda in Europe will highlight Construction Output figures for January. Additionally, European Central Bank (ECB) President Christine Lagarde is scheduled to speak at the ECB at the Watchers conference in Frankfurt during European trading hours.
EURUSD DAILY CHART: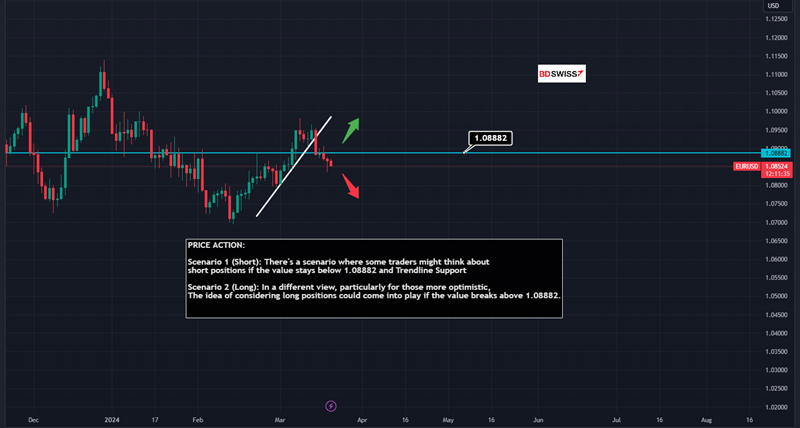
XAUUSD TECHNICAL ANALYSIS: 20th MARCH, 2024
PRICE ACTION:
Scenario 1 (Short): It could be observed that there might be potential for short positions if the price breaks below $2148.014
Scenario 2 (Long): In a contrasting view, there might be potential for long positions if the price stays above $2148.014, which could interest those with an optimistic outlook.
Quick Fundamental: Gold remained trapped in a sideways pattern, recording minor declines on Tuesday. The XAUUSD pair persisted in fluctuating within a narrow band, oscillating between $2,150 and $2,160 midweek.
XAUUSD DAILY CHART: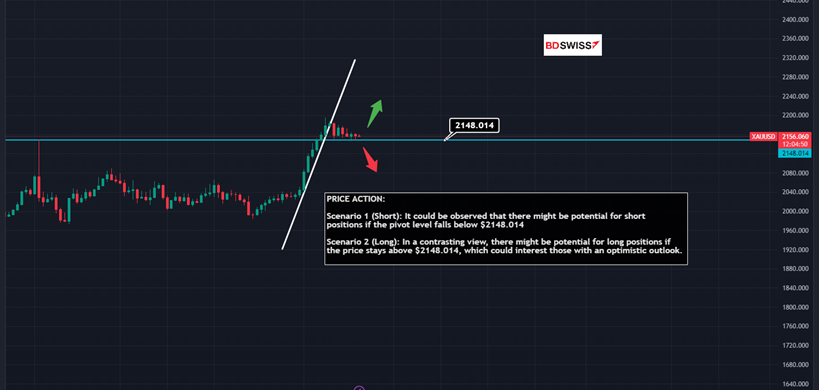 GBPUSD TECHNICAL ANALYSIS: 20th MARCH, 2024
PRICE ACTION:
Scenario 1 (Short): Observationally, one might note a trend where short positions are initiated if price remains below Trendline Resistance
Scenario 2 (Long): From an optimistic viewpoint, it could be noted that long positions may typically start if price breaks above 1.27473 and Trendline Resistance
Quick Fundamental: On Wednesday morning, the Office for National Statistics in the UK disclosed that the yearly inflation rate, gauged by the Consumer Price Index (CPI), dropped to 3.4% in February from January’s 4%. The report also revealed that the annual Retail Price Index met forecasts by rising 4.5%, while the Producer Price Index – Input witnessed a decrease of 2.7%. Following the release of this data, the GBPUSD exchange rate maintained stability, hovering just above 1.2700.
GBPUSD DAILY CHART: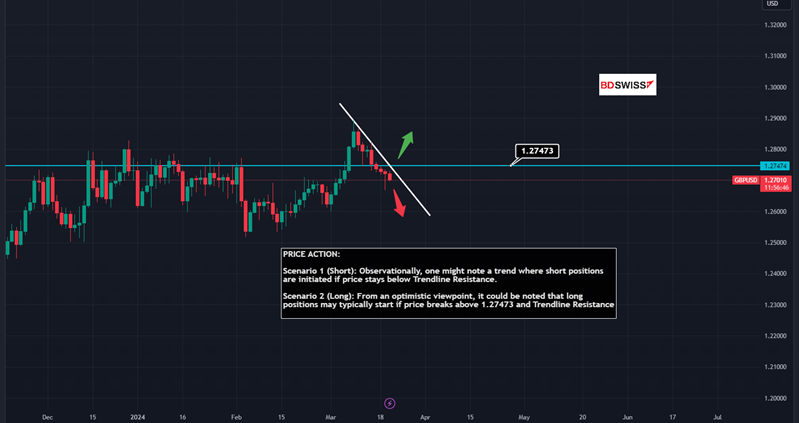 USOIL(WTI) TECHNICAL ANALYSIS: 20th MARCH, 2024
PRICE ACTION:
In Scenario 1, there’s a tendency for short positions when the price breaks below $81.58
In Scenario 2, it’s often observed that long positions are considered when the price stays above $81.58, especially among optimists.
Quick Fundamental: During Asian trading hours on Wednesday, the West Texas Intermediate (WTI) oil price dipped close to $82.40 per barrel as crude oil prices retreated from recent peaks, prompting investors to lock in profits. Furthermore, market sentiment remained cautious ahead of the US Federal Reserve’s impending interest rate decision. The strengthening US Dollar (USD) is exacerbating oil costs for nations with alternative currencies, thereby influencing oil demand.
USOIL DAILY CHART: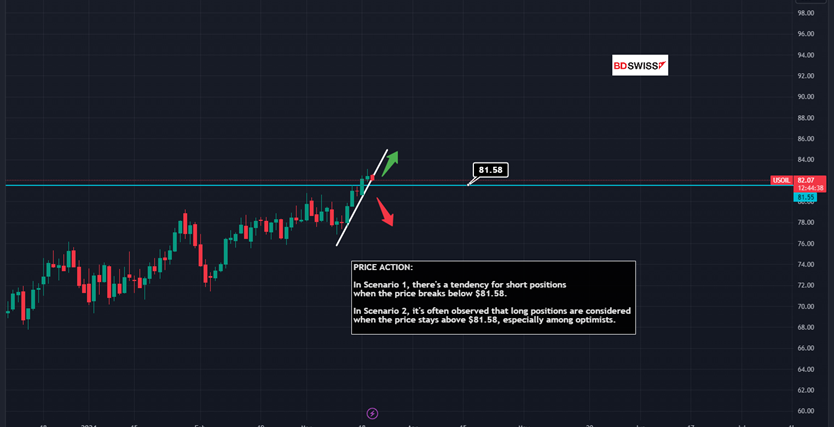 BTCUSD (BITCOIN) TECHNICAL ANALYSIS: 20th MARCH, 2024
PRICE ACTION:
Scenario 1 (Short): If one were looking at potential market movements, a scenario might involve contemplating short positions if the value were to stay below $64,656.20 and Trendline Resistance.
Scenario 2 (Long): In a situation where market optimism prevails, one hypothetical approach could be to consider long positions if the value breaks above $64,656.20 and Trendline Resistance.
Quick Fundamental: Bitcoin (BTC) dipped below the $65,000 mark on Tuesday, dragging Ethereum (ETH) and Ripple (XRP) prices down alongside it. Market volatility surged as anticipation builds for Wednesday’s Federal Open Market Committee (FOMC) policy meeting.
Despite this, optimism prevails among crypto market participants due to expectations of a pause in interest rate hikes. Such a move suggests a more accommodating stance by the Fed towards the economy, possibly sparking a rally in both Bitcoin and alternative cryptocurrencies. This could foster increased investor risk appetite, providing a bullish outlook for the crypto market.
BTCUSD DAILY CHART: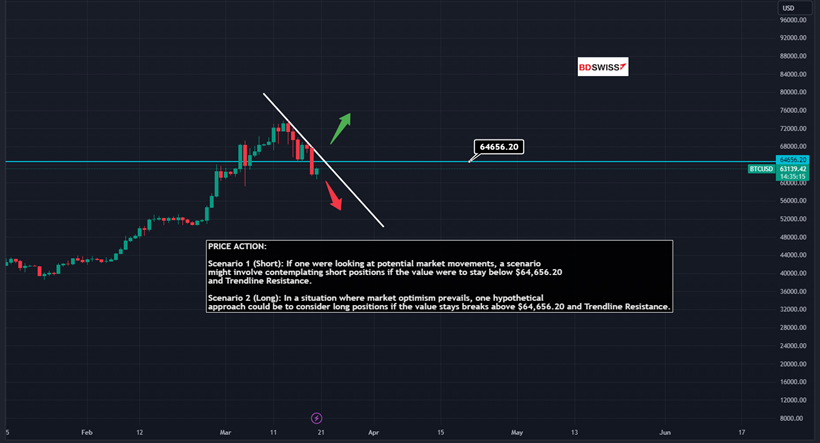 Source: Fxstreet.com | Tradingview.com


