

In this Analysis, we will delve into the Daily (D) timeframe to gain a comprehensive view of the current state of EURUSD, XAUUSD, GBPUSD, USOIL, & BTCUSD for Today, 13th March, 2024.
Additionally, we will briefly touch on a fundamental factor influencing its price.
EURUSD TECHNICAL ANALYSIS: 13th MARCH , 2024
PRICE ACTION:
Scenario 1 (Short): There’s a scenario where some traders might think about short positions if the value goes below 1.08882 and Trendline Support.
Scenario 2 (Long): In a different view, particularly for those more optimistic, The idea of considering long positions could come into play if the value stays above Trendline Support.
Quick Fundamental:
The EURUSD bounced back following a touch of support around 1.0900, ending the day unchanged on Tuesday. Throughout the European morning, the pair hovered within a narrow range near 1.0930.
EURUSD DAILY CHART: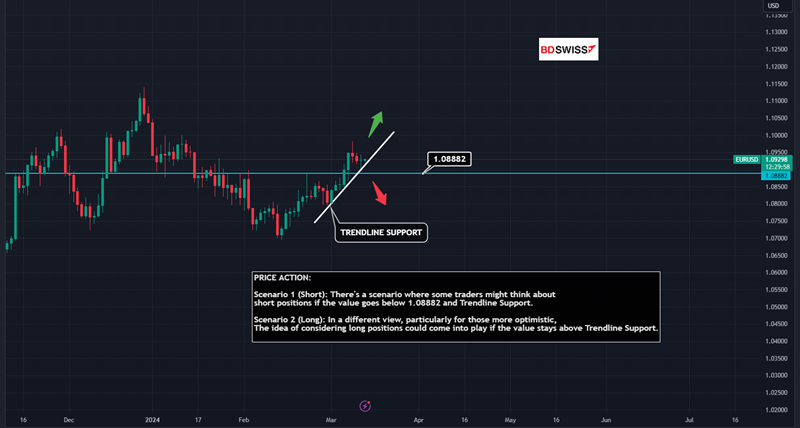 XAUUSD TECHNICAL ANALYSIS: 13th MARCH, 2024
PRICE ACTION:
Scenario 1 (Short): It could be observed that there might be potential for short positions if the pivot level falls below $2148.301
Scenario 2 (Long): In a contrasting view, there might be potential for long positions if the level rises above $2193.781, which could interest those with an optimistic outlook.
Quick Fundamental: Gold’s nine-day winning streak came to an end on Tuesday, dropping by over 1% due to the resurgence of US T-bond yields. XAUUSD remains in a consolidation phase, hovering around $2,160 as of Wednesday.
XAUUSD DAILY CHART: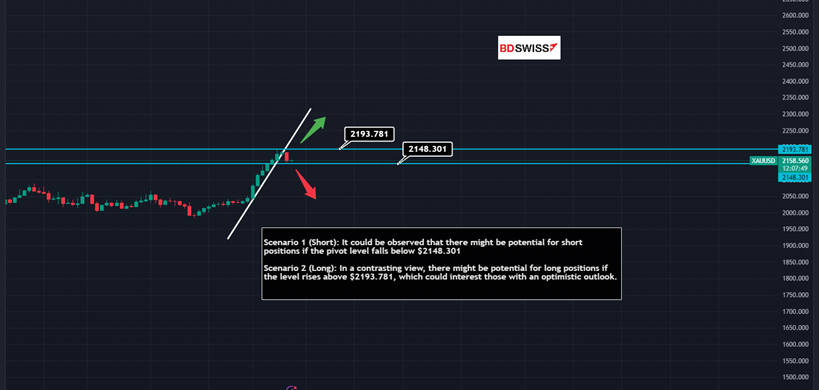 GBPUSD TECHNICAL ANALYSIS: 13th MARCH, 2024
PRICE ACTION:
Scenario 1 (Short): Observationally, one might note a trend where short positions are initiated below 1.28279 and Trendline Support.
Scenario 2 (Long): From an optimistic viewpoint, it could be noted that long positions may typically start above 1.28279
Quick Fundamental:
During the European morning, GBPUSD remains stable near 1.2800 following two successive days of decline on Tuesday. The Office for National Statistics in the UK revealed that the real Gross Domestic Product (GDP) saw a 0.2% monthly expansion in January, contrasting with December’s 0.1% contraction and meeting market forecasts.
GBPUSD DAILY CHART: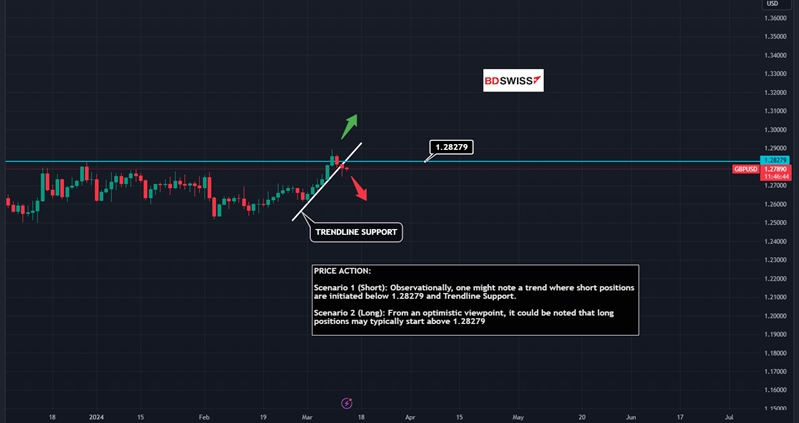 USOIL(WTI) TECHNICAL ANALYSIS: 13th MARCH, 2024
PRICE ACTION:
In Scenario 1, there’s a tendency for short positions when the price stays below $79.56.
In Scenario 2, it’s often observed that long positions are considered when the price exceeds $79.56, especially among optimists.
Quick Fundamental: During the first half of Wednesday’s European session, West Texas Intermediate (WTI) US Crude Oil prices experienced selling pressure, keeping them subdued. Despite this, the commodity stayed within the trading range established the previous day, reflecting mixed fundamental signals, and maintained a position above the mid-$77.00s.
USOIL DAILY CHART: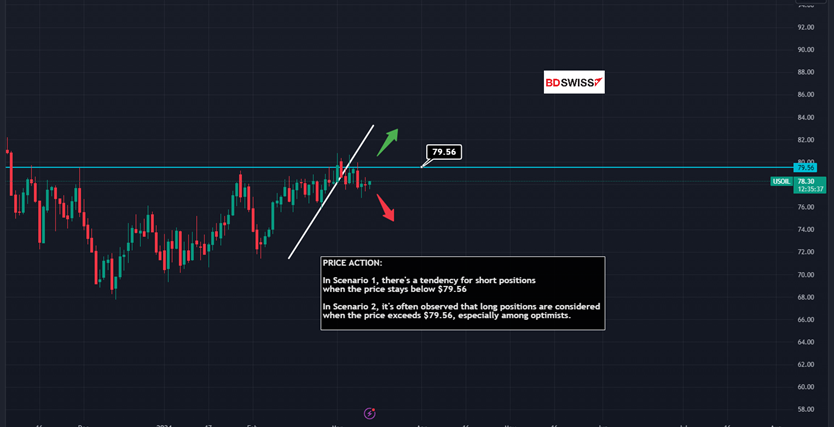 BTCUSD (BITCOIN) TECHNICAL ANALYSIS: 13th MARCH, 2024
PRICE ACTION:
Scenario 1 (Short): If one were looking at potential market movements, a scenario might involve contemplating short positions if the value were to drop below $69,196.04 and Trendline Support.
Scenario 2 (Long): In a situation where market optimism prevails, one hypothetical approach could be to consider long positions if the value stays above Trendline Support.
Quick Fundamental:
The price of Bitcoin has hit its fourth consecutive all-time high this week, now surpassing $72,000. According to analysts at Glassnode, this surge in BTC value is fueled by a shift in market sentiment towards euphoria. Despite this bullish momentum, there seems to be a balanced dynamic between distribution pressure and new demand in the market, indicating a pattern of cyclical peaks. While the potential for further upside in Bitcoin’s price may seem stretched, bullish investors continue to drive the market forward unabated. Additionally, research from Glassnode suggests a notable increase in profit-taking and demand for long positions, signaling ongoing bullish sentiment.
BTCUSD DAILY CHART: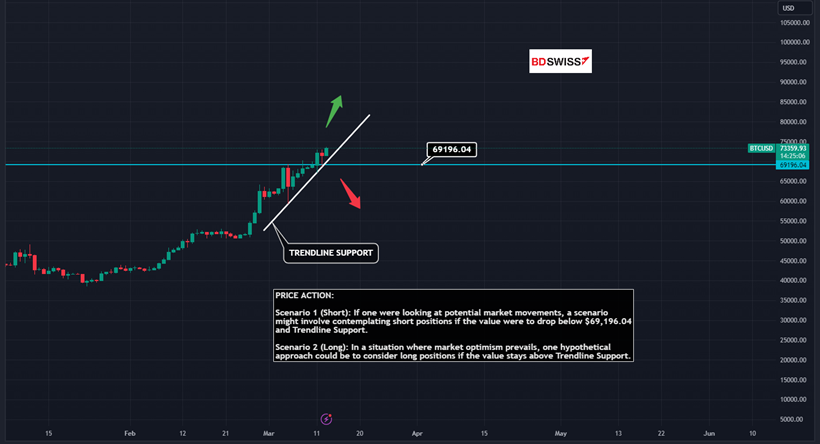 Source: Fxstreet.com | Tradingview.com


