

PREVIOUS TRADING DAY EVENTS – 20 July 2023
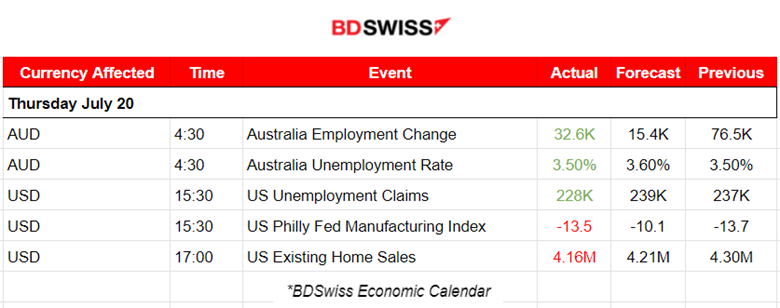
According to the Australian Bureau of Statistics, net employment rose by 32,600 in June. The unemployment rate was recorded at 3.5% whereas analysts had expected 3.6%.
The Reserve Bank of Australia (RBA) has lifted interest rates by 400 basis points to an 11-year high of 4.1% in just 14 months, however, the Labor Market is still hot, raising concerns.
Incoming RBA Governor Michele Bullock has said that the jobless rate would need to rise to about 4.5% in order to have an important impact on inflation.
This is the second straight weekly decline in claims reported by the Labor Department. The data suggest that the economy is preventing a recession this year. In addition, recent data show that inflation has been subsiding in June. Labour market strength is also supporting wage growth, boosting consumer spending.
“The warning clouds of recession have scattered and company layoffs have come back down,” said Christopher Rupkey, Chief Economist at FWDBONDS in New York. “If there is a recession out there, it is one without too many job losses. We don’t know of any such recessions in economic history so there must not be one looming.”
The U.S. central bank is expected to resume hiking rates next Wednesday, 26th July, after skipping an increase in June. The Fed has raised its policy rate by 500 basis points since March 2022.
The labour market remains resilient even though housing and manufacturing continue to struggle.
Source: https://www.reuters.com/world/us/us-weekly-jobless-claims-unexpectedly-fall-2023-07-20/
______________________________________________________________________
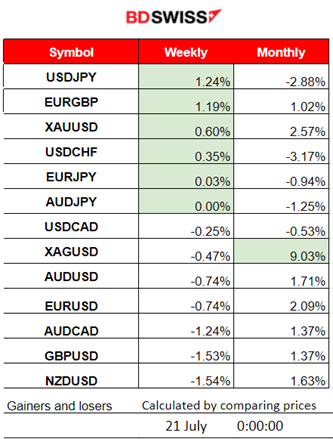
Winners vs Losers
______________________________________________________________________
News Reports Monitor – Previous Trading Day (20 July 2023)
Server Time / Timezone EEST (UTC+03:00)
- Midnight – Night Session (Asian)
Early at 4:30, the Employment data for Australia were released showing fewer jobs but more than expected. The unemployment rate remained unchanged. The figures caused the market to react with AUD appreciation and an intraday shock for AUD pairs. The AUDUSD jumped over 50 pips.
- Morning – Day Session (European)
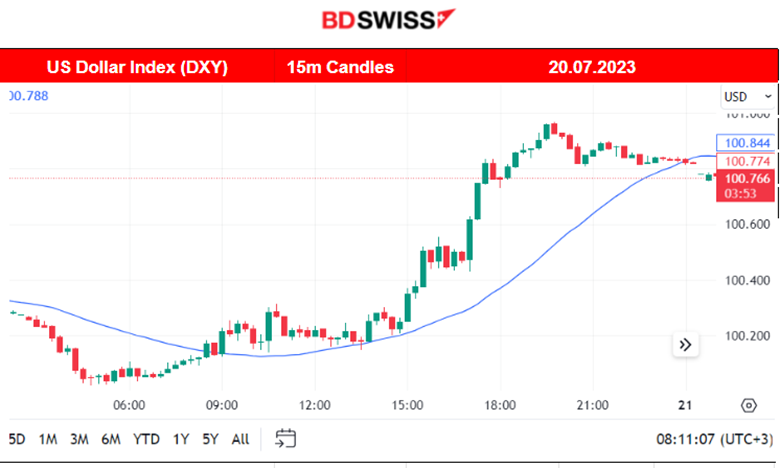
At 15:30, the weekly release of the U.S. unemployment claims along with the release of the Philly Fed Manufacturing Index figure took place. The Claims were reported lower than expected. Inflation in the U.S. has significantly dropped, however, these labour data are suggesting that the impact on the market is not as negative as it is expected. That is good for economic activity but it also adds to the possibility that the Fed will likely proceed with a future rate hike on the 26th of July. After the release, USD showed rapid intraday strengthening causing the DXY to close higher. The Philly Fed Manufacturing Index has reported an almost unchanged negative figure, -13.5 versus the previous -13.7. The data suggest that manufacturing activity in the region continued to decline overall, more than it was expected.
At 17:00 the U.S. Existing Home Sales figures showed that U.S. home sales dropped in June to the slowest pace in 14 years. The figure was recorded 4.16M versus the previous 4.30M. Compared with June of last year, sales were 18.9% lower. That is the slowest sales pace for June since 2009. The continued weakness in the housing market is a result of a critical shortage of supply. USD kept appreciating greatly against other currencies after the release.
General Verdict:
____________________________________________________________________
FOREX MARKETS MONITOR
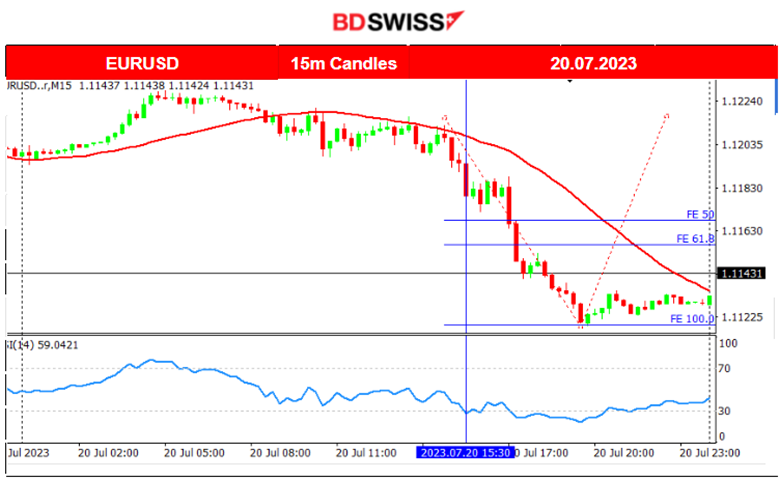
EURUSD (20.07.2023) Chart Summary
Server Time / Timezone EEST (UTC+03:00)
Price Movement
Apparently, the USD drives the path of the pair as it experiences appreciation during the trading day. The pair moves with low volatility before the major figure releases at 15:30. After that time, a rapid downward movement starts as the U.S. Unemployment claims were reported lower than expected. The market reacts with USD appreciation against major currencies and moves even further downwards after the 17:00 Existing Home Sales figure release until it finds support at 1.11170. The pair did not retrace intraday. This raises doubts about the next day’s movement. Retracement might not happen fully back to the 61.8 Fibo level if USD does not experience early weakness.
___________________________________________________________________
EQUITY MARKETS MONITOR
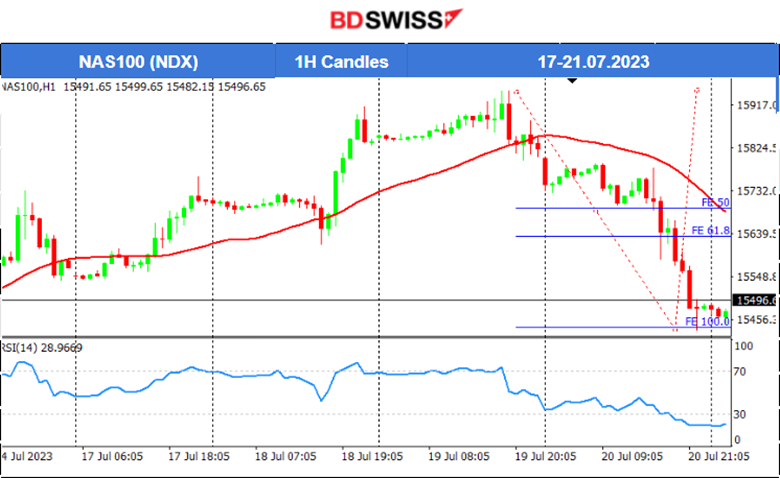
NAS100 (NDX) 4-Day Chart Summary
Server Time / Timezone EEST (UTC+03:00)
Price Movement
The U.S. labour market data and the inflation-related data have caused an unusual uptrend for the benchmark indices lately and a market reaction that seems to keep indices high enough. The RSI showed signals of bearish divergence and on the 18th of July, the index moved to the downside at first as soon as the NYSE opened. It however found strong resistance and reversed fully, surprisingly climbing to higher and higher levels. On the 19th, the index moved early upwards but during the N. American Session dropped heavily sometime after the NYSE opening. On the 20th of July, the index fell surprisingly fast, especially after the start of the European session. No retracement yet after this reversal.
Trading Opportunities
Our analysis on Tradingview
:https://www.tradingview.com/chart/NAS100/J9hEbeqc-NAS100-Reversal-21-07-2023/
______________________________________________________________________
COMMODITIES MARKETS MONITOR
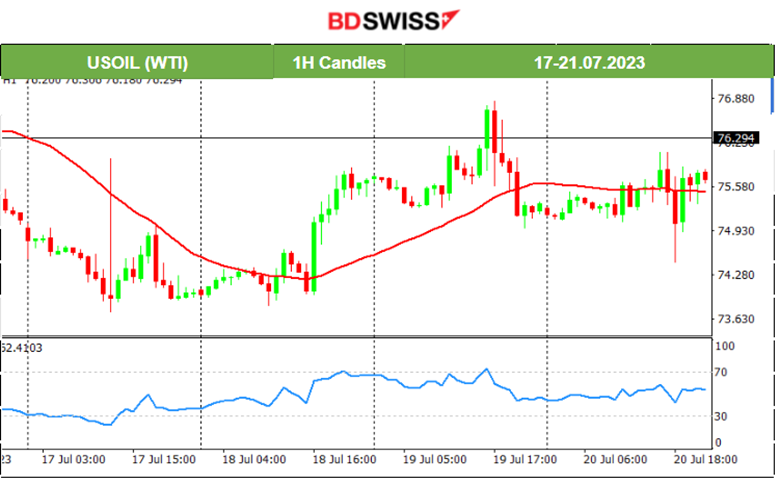
USOIL (WTI) 4-Day Chart Summary
Server Time / Timezone EEST (UTC+03:00)
Price Movement
After a couple of days of an upward movement, on the 19th, Crude reversed and crossed the 30-period MA on its way down, remaining in that area. On the 20th of July, the path was sideways but volatile enough keeping the mean at the level near 75.60 USD/b. The RSI is moving as per the price path with no data, hence, not providing an understanding of any future rapid movements to one side. However, we can identify the important resistance at near 76.80 USD/b and the resistance that was tested already at 74.60 USD/b. Breaking either during volatile market conditions caused by major releases will probably cause rapid and one-direction moves towards the next levels.
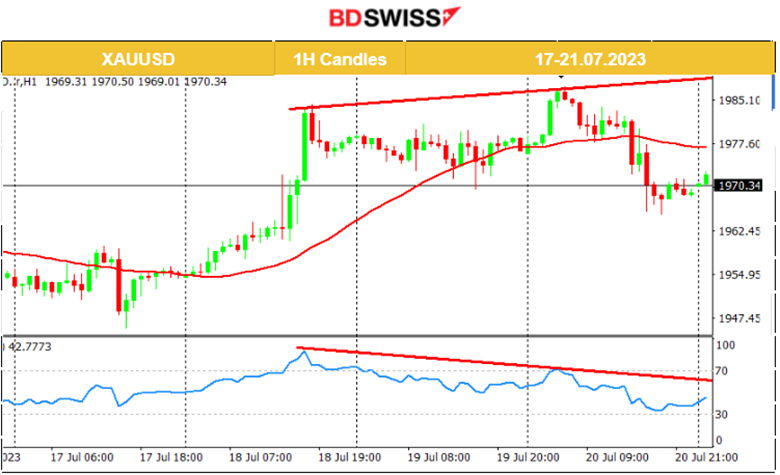
XAUUSD (Gold) 4-Day Chart Summary
Server Time / Timezone EEST (UTC+03:00)
Price Movement
On the 19th, the price followed a sideways path with low volatility, remaining in that consolidation phase until the end of the trading day. The next day, July 20th, Gold moved early upwards. RSI was showing signs of bearish divergence with lower highs, apparently the opposite of what the price was doing. Gold eventually reversed downwards rapidly, moving out of consolation, breaking the support levels near 1971 USD/oz and crossing the 30-period MA on its way down. The dollar is currently gaining strength and that is a major driving factor.
______________________________________________________________
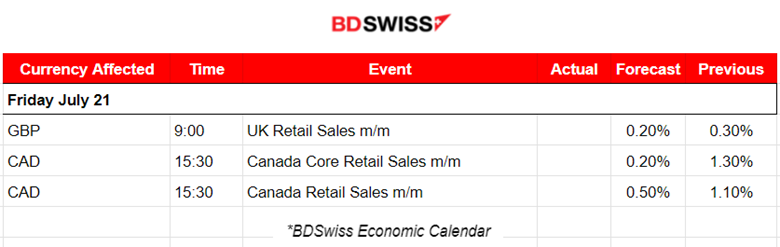
News Reports Monitor – Today Trading Day (21 July 2023)
Server Time / Timezone EEST (UTC+03:00)
- Midnight – Night Session (Asian)
No important news announcements, now major scheduled releases.
- Morning – Day Session (European)
At 9:00 the monthly U.K. Retail sales data are going to be released. Expected figures are lower than those of the previous reports. These expectations are justifiable considering the aggressive hikes from BOE and data suggesting the cooling of the labour market. The latest change in the number of people claiming unemployment in the U.K. was 25.7K, way more than the previous figure which was negative at -22.5K. Near the start of the European Session, volatility is usually high and a possible intraday shock is expected for GBP pairs.
At 15:30 the Retails Sales figures for Canada are about to be released with lower forecasts, too. The BOC keeps following the same policy with rate increases trying to have an impact on spending, bringing inflation down. The inflation rate year over year is 2.8% (compared to 3.4% for the previous month). CAD pairs are expected to be affected with a possible moderate intraday shock.
General Verdict:
______________________________________________________________


