

Previous Trading Day’s Events (22 Jan 2024)
______________________________________________________________________
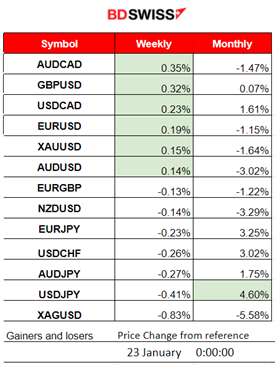
Winners vs Losers
AUDCAD moved to the top with 0.35% gains for the week while USDJPY stays on the top of the month’s winner’s list with 4.60% gains. The JPY pairs (JPY as Quote) moved to the downside due to the BOJ news this morning.
 ______________________________________________________________________
News Reports Monitor – Previous Trading Day (22 Jan 2024)
Server Time / Timezone EEST (UTC+02:00)
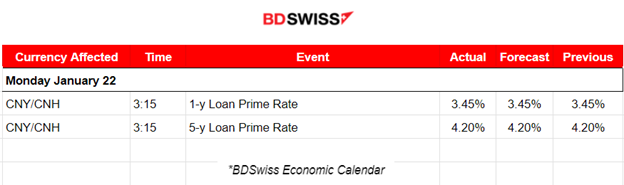
- Midnight – Night Session (Asian)
No major announcements, no important special scheduled releases.
- Morning–Day Session (European and N. American Session)
No major announcements, no important special scheduled releases.
General Verdict:
 ____________________________________________________________________
FOREX MARKETS MONITOR
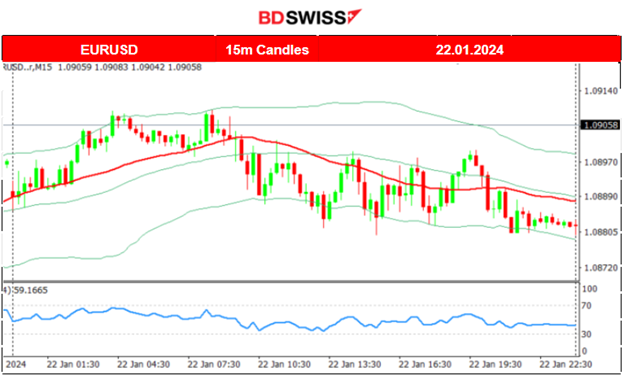
EURUSD (22.01.2024) 15m Chart Summary
Server Time / Timezone EEST (UTC+02:00)
Price Movement
The pair experienced low volatility due to absence of important scheduled releases. It moved early to the upside above the 30-period MA and then reversed to the downside crossing the MA on its way down remaining on a roughly sideways path around the MA, leaning more to the downside as a result of USD strengthening.
 ___________________________________________________________________
CRYPTO MARKETS MONITOR
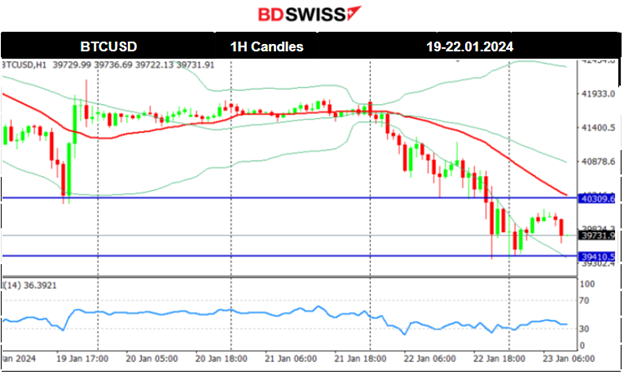
BTCUSD (Bitcoin) Chart Summary 1H Timeframe
Server Time / Timezone EEST (UTC+02:00)
Price Movement
After the Spot Bitcoin ETF approval from the SEC, Bitcoin saw an unusual fall in value. On the 18th Jan, it dropped heavily until the support near 40600 USD. Retracement followed but on the 19th it saw another drop to 40200 USD. On the same day, it recovered fully and on its way up it crossed the 30-period MA showing strength, settling at near 41600 USD. On the 22nd Jan, the price dropped heavily again reaching and testing the 40600 USD support once more, breaking that support and now eventually falling further to 39400 USD. The picture does not look good for Bitcoin in the short-term. It currently experienced the retracement to 40100 USD and is on the way testing the lows again.
Crypto sorted by Highest Market Cap:
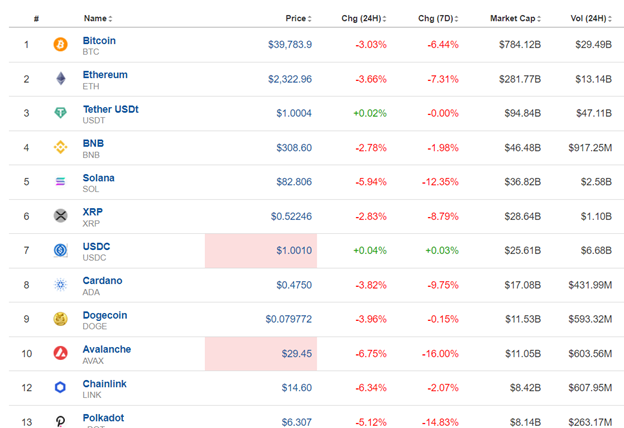
The whole market is obviously suffering as most Crypto show high losses. Partly to blame for Bitcoin’s poor price performance is enormous selling after the ETF approval date, i.e.Grayscale Bitcoin Trust (GBTC).
______________________________________________________________________
EQUITY MARKETS MONITOR
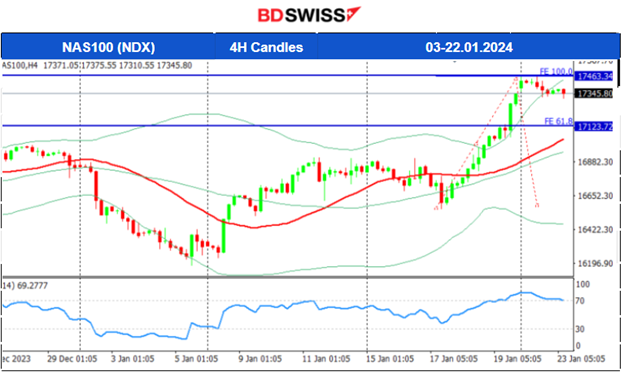
NAS100 (NDX) 4Hour Timeframe Chart Summary
Server Time / Timezone EEST (UTC+02:00)
Price Movement
All benchmark U.S. indices moved to the upside quite rapidly in the past few days, particularly since the 17th Jan. The uptrend is clear with some retracements taking place every day, however not being complete as the path is quite strong to the upside. The 4H chart below shows why this is clear. Volatility levels are higher than usual. I am expecting a retracement soon. The Fibo Expansion shows that further movement to the downside, breaking the 17300 USD level, would indicate a drop to the 61.8 Fibo level, near 17100 USD at least.
 ______________________________________________________________________
COMMODITIES MARKETS MONITOR
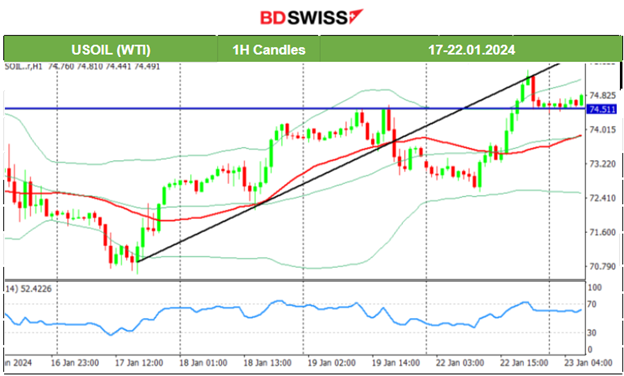
USOIL (WTI) 4-Day Chart Summary
Server Time / Timezone EEST (UTC+02:00)
Price Movement
Crude oil experienced a short-term upward trend from the 17th to the 19th Jan. After the reversal to the upside on the 17th it crossed the 30-period MA on its way up and found strong resistance near 74.5 USD/b before reversing again to the downside heavily. It crossed the MA on its way down showing signs that the uptrend ended and a more probable sideways but volatile movement is following next. 72.5 USD/b served as support and a turning point on the 22nd Jan. The price reversed crossing the MA on its way up, breaking the resistance at 74.5 USD/b reaching the next at 75.5 USD/b before retracing. It looks like it is destined to return back and touch the MA.
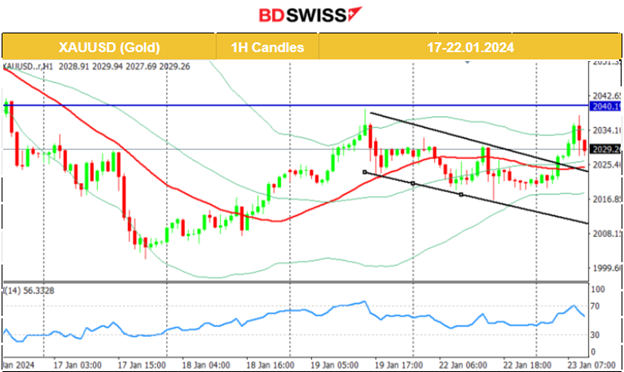
XAUUSD (Gold) 4-Day Chart Summary
Server Time / Timezone EEST (UTC+02:00)
Price Movement
On the 18th Jan, the price moved to the upside, crossing the MA on its way up reaching the 61.8 Fibo level. Seemingly, preference for Gold increased as currently the dollar value remains stable against other currencies. The upward movement found resistance on the 19th Jan near 2041 SUD/oz and the price reversed to the MA. The price continued sideways with high volatility around the mean but leaning more to the downside inside what looks like a downward channel. Today that channel was broken when the USD depreciated greatly early and Gold jumped, testing the resistance near 2040 USD/oz without success.
 ______________________________________________________________
News Reports Monitor – Today Trading Day (23 Jan 2024)
Server Time / Timezone EEST (UTC+02:00)
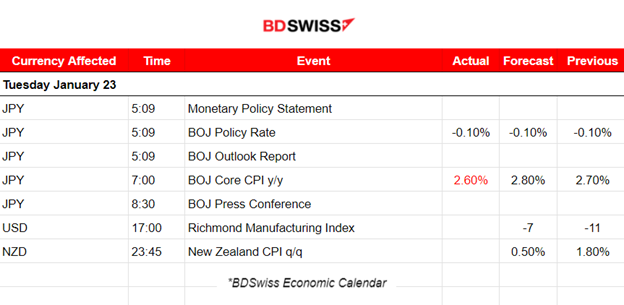
- Midnight – Night Session (Asian)
The BOJ keeps interest rates steady, policy rate at -0.10%, ultra-easy policy as widely expected. The central bank noted that the likelihood of the economy achieving durable 2% inflation continued to “gradually rise”. The market reacted with strong JPY appreciation at the time of the release followed by a quick retracement. The USDJPY dropped nearly 60 pips upon policy rate release and more than 100 pips during the press conference that took place later at 8:30 and retraced again quickly.
- Morning–Day Session (European and N. American Session)
The USD could see more volatility near 17:00 during the release of the Richmond Manufacturing Index figure. However no major impact or intraday shock is expected.
At 23:45, on the 23rd Jan, the NZD pairs could move significantly upon the quarterly CPI change figure release for New Zealand. That inflation measure is expected to be reported lower.
General Verdict:
______________________________________________________________


