Previous Trading Day’s Events (13.03.2024)
GDP grew by 0.2% month-on-month, boosted by a rebound in retailing and house-building – after a fall of 0.1% in December as expected.
“The economy picked up in January with strong growth in retail and wholesaling,” Liz McKeown, a director at the Office for National Statistics, said. “Construction also performed well with house-builders having a good month, having been subdued for much of the last year.”
With inflation at 4% in January, down from double-digit rates in much of last year, and forecast to return to its 2% target soon, the squeeze on household spending is easing and the Bank of England (BoE) is starting to consider when to cut interest rates.
Source: https://www.reuters.com/world/uk/uk-economy-grows-by-02-january-2024-03-13
______________________________________________________________________
Winners vs Losers
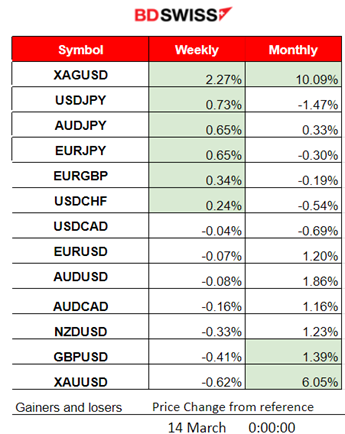
Silver (XAGUSD) takes the lead as it moved greatly to the upside yesterday marking a 2.27% gain for the week and a 10% gain this month.
 ______________________________________________________________________
News Reports Monitor – Previous Trading Day (13 Mar 2024)
Server Time / Timezone EEST (UTC+02:00)

- Midnight – Night Session (Asian)
No important announcements, no special scheduled releases.
- Morning–Day Session (European and N. American Session)
The monthly real gross domestic product (GDP) for the U.K. is estimated to have grown by 0.2% in January 2024, following a fall of 0.1% in December 2023. Real GDP is estimated to have fallen by 0.1% in the three months to January 2024, compared with the three months to October 2023. Services output grew by 0.2% in January 2024 and was the largest contributor to the rise in GDP, but in the three months to January 2024, services output showed no growth. The market reacted with slight GBP depreciation upon release.
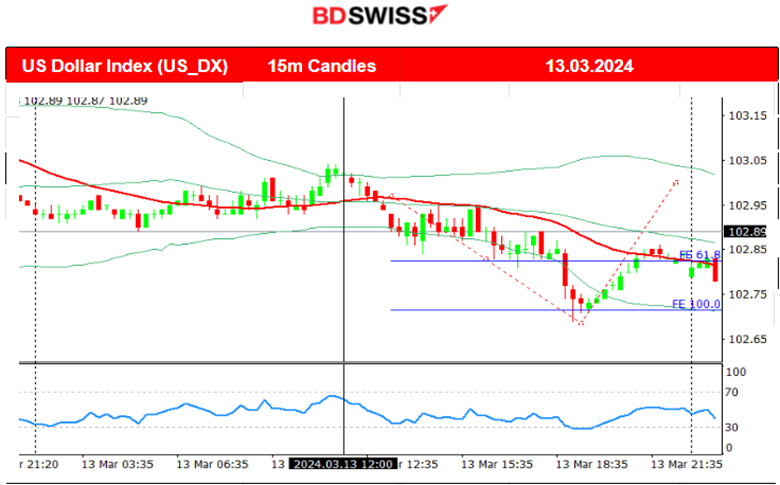
General Verdict:
 __________________________________________________________________
FOREX MARKETS MONITOR
EURUSD (13.03.2024) 15m Chart Summary
Server Time / Timezone EEST (UTC+02:00)
Price Movement
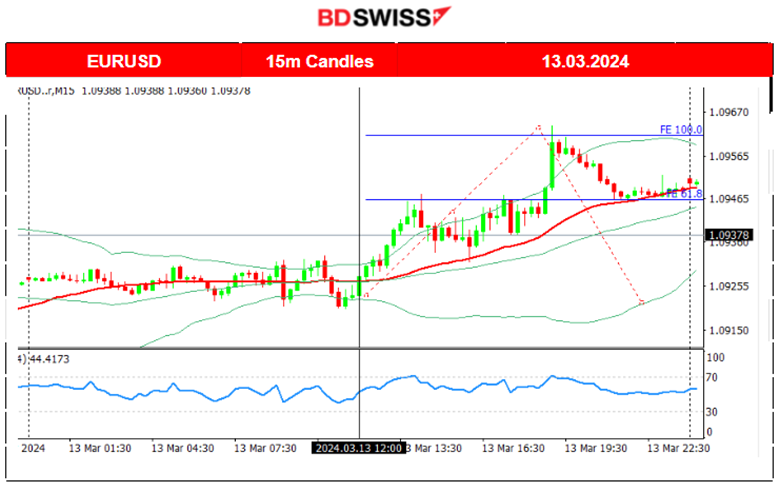
The pair moved to the upside with high volatility after the start of the European session, driven by USD depreciation yesterday. With the absence of significant scheduled releases, it was a steady movement that soon ended after finding resistance and then retracing to the MA (and the 61.8 Fibo) for the rest of the trading day.
 ___________________________________________________________________
CRYPTO MARKETS MONITOR
BTCUSD (Bitcoin) Chart Summary
Server Time / Timezone EEST (UTC+02:00)
Price Movement
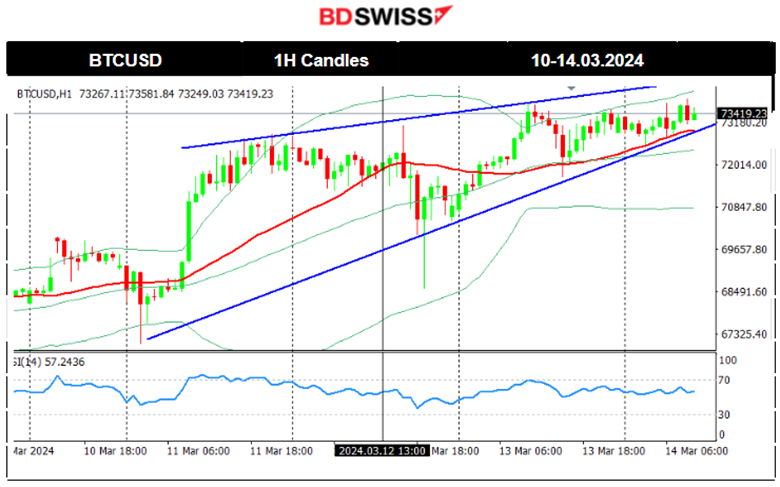
Bitcoin continues with the uptrend. It broke the 70K resistance aggressively and jumped further breaking all-time highs reaching over 73K USD.
Flows of capital into the 10 largest U.S. spot bitcoin exchange-traded funds slowed to a two-week low in the week to March 8th but still reached almost 2 billion USD, LSEG data showed.
Supply of bitcoin, which is limited to 21 million tokens, is set to get tighter in April when the so-called “halving” event takes place and this event tends to support the price.
The Financial Conduct Authority (FCA) became the latest regulator to pave the way for digital asset trading products after saying on Monday it will now permit recognized investment exchanges to launch crypto-backed exchange-traded notes. The UK regulator said these products would be only available for professional investors such as investment firms and credit institutions authorised to operate in financial markets.
Source:
https://www.reuters.com/technology/bitcoin-hits-new-record-high-above-70400-2024-03-11/
 Crypto sorted by Highest Market Cap:
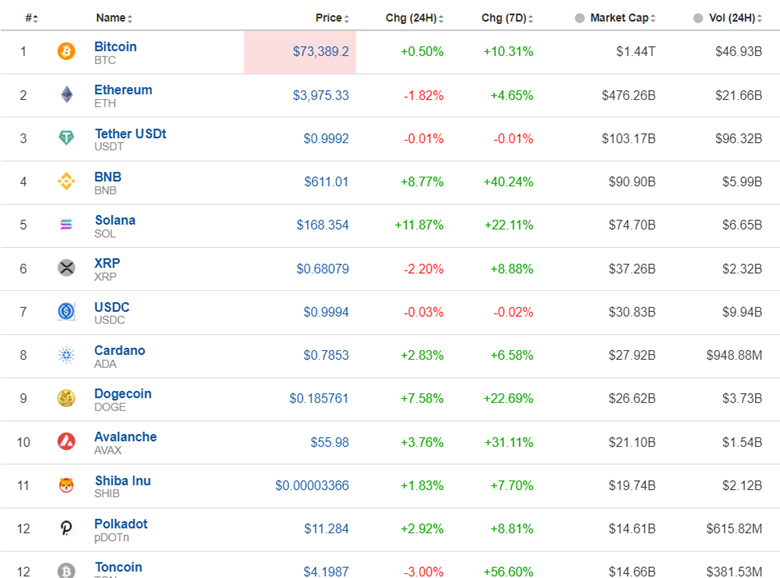 Crypto market remains high and holds gains. Solana leads with nearly 11.8% gains in the last 24 hours.
Source: https://www.investing.com/crypto/currencies
______________________________________________________________________
EQUITY MARKETS MONITOR
NAS100 (NDX) 4-Day Chart Summary
Server Time / Timezone EEST (UTC+02:00)
Price Movement
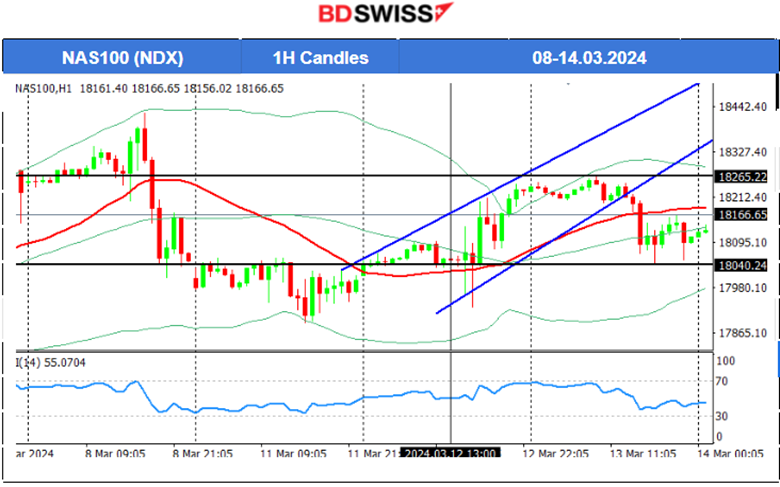
On the 11th of March, the USD actually showed strength and indices fell further downwards with NAS100 reaching the support at 17,890 USD before retracing to the 30-period MA and back to the 18,000 USD level. On the 12th of March, the inflation report release figures had actually caused the U.S. Indices to climb. An upward wedge is visible with a clear resistance level at nearly 18,265 USD. On the 13th March the upward wedge was broken to the downside and the index dropped until the support at near 18,040 USD.
 ______________________________________________________________________
COMMODITIES MARKETS MONITOR
USOIL (WTI) 4-Day Chart Summary
Server Time / Timezone EEST (UTC+02:00)
Price Movement
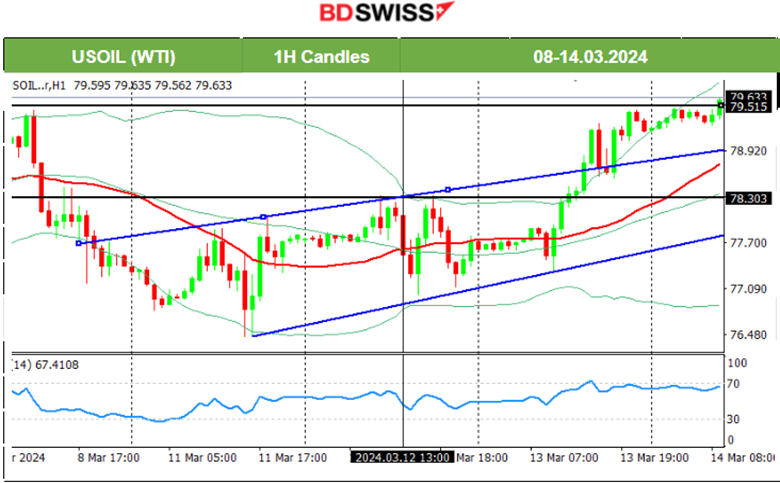
Given OPEC’s production cuts and Russian sanctions slowing exports causing price resilience, it excludes the probabilities of sharp drops, keeping prices in balance. Crude oil retraced on the 11th of March and continued trading in range during the inflation report on the 12th of March. A breakout of the resistance on the 13th of March caused its price to move away from the 78 USD/b level and reach higher at 79.5 USD/b. The RSI is signalling a bearish divergence with its lower highs currently.
 XAUUSD (Gold) 4-Day Chart Summary
Server Time / Timezone EEST (UTC+02:00)
Price Movement
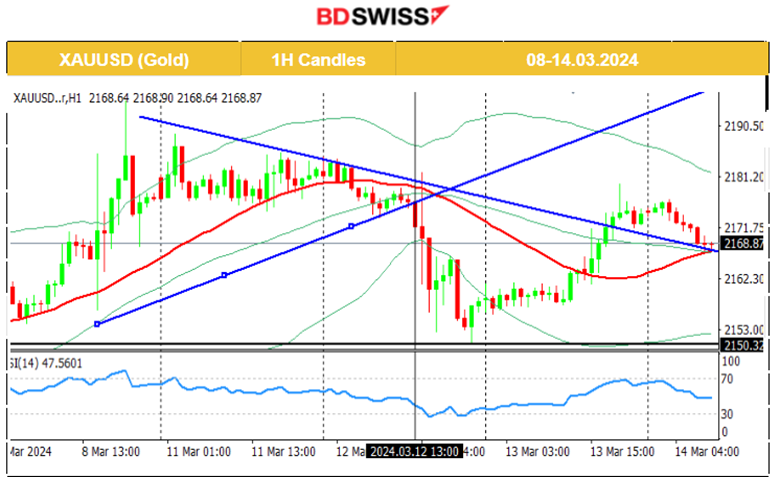
Gold will be pushed to the downside only if the Fed hints that there will be delays in cuts, following the hooter than expected inflation. GOLD remained high as it moved to the upside on the 13th of March. The U.S. dollar (USD) weakened and Gold moved to the upside crossing the 30-period MA on its way up. The RSI does not show any divergence and moves along with the price making the future path uncertain. The PPI report at 14:30 today might cause the dollar to experience a shock and give some hint about market participants’ expectations regarding the future of the USD and Gold. The level of 2,150 USD remains the crucial support.
 ______________________________________________________________
News Reports Monitor – Today Trading Day (14 Mar 2024)
Server Time / Timezone EEST (UTC+02:00)
- Midnight – Night Session (Asian)
No important announcements, no special scheduled releases.
- Morning–Day Session (European and N. American Session)
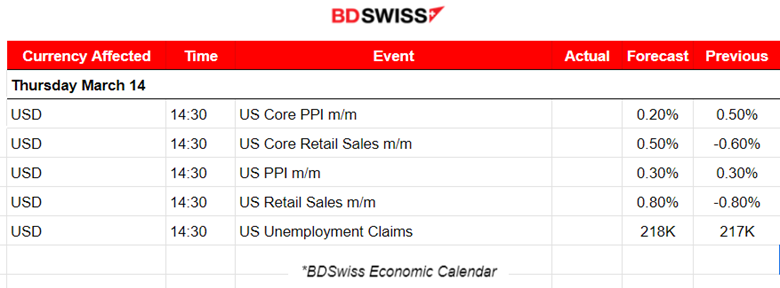
U.S. PPI figures are going to be released at 14:30 and are expected to be reported steady with the Core figure expectation to be lower. They serve as inflation-related data and the market could react upon release with USD pairs to experience higher volatility than normal. The CPI figures are released first this week and that is why the effect might not be so strong with the PPI release. A surprise increase is actually quite possible and thus USD appreciation due to the fact that the labour market shows unusual strength according to the latest reports.
U.S. retail sales figures are expected obviously to show higher changes as business conditions are getting better in the U.S. recently with reported PMIs to be in expansion. At that time an intraday USD appreciation could take place at the time of the release if we also take this information into account.
General Verdict:
______________________________________________________________


