

In a surprising twist late in the North American session, gold prices surged to a new all-time high of $2222.65. This sudden spike followed the Federal Reserve’s decision to maintain its unchanged interest rates at 5.50%. However, the Fed also revised upward its projections for the Federal Funds Rates (FFR) for 2025, adding to the market’s volatility and uncertainty.
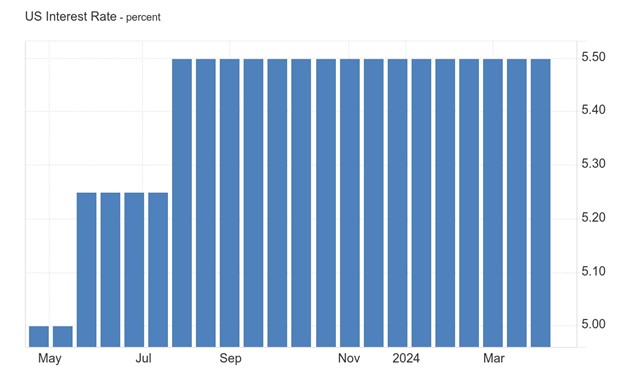 Yesterday, 20th March 2024, the Federal Reserve maintained the fed funds rate at a steady 5.25%-5.5%, marking the fifth consecutive meeting with no change, aligning with market expectations. The Fed intends to cut interest rates three times this year, consistent with the quarterly forecasts made in December. However, the outlook for 2025 revealed a slight adjustment, with plans for three cuts, one less than previously projected, and an additional three reductions in 2026.
Meanwhile, projections for US GDP growth indicate improvements across the board, with forecasts showing higher growth rates for 2024 (2.1% vs. 1.4% in December), 2025 (2% vs. 1.8%), and 2026 (2% vs. 1.9%). Although PCE inflation forecasts remained unchanged for 2024 (2.4%), they were raised slightly for 2025 (2.2% vs. 2.1%), with a corresponding increase in the core rate for the current year (2.6% vs. 2.4%). Projections for 2025 remained steady at 2.2%.
Additionally, the unemployment rate is expected to decline to 4% in 2024 (vs. 4.1%), while projections for the following year remain unchanged at 4.1%.
In the United States, the authority to set interest rates is split between the Board of Governors of the Federal Reserve (Board) and the Federal Open Market Committee (FOMC). The Board determines changes in discount rates based on recommendations from one or more regional Federal Reserve Banks, while the FOMC determines open market operations, including central bank money levels or the desired federal funds market rate.
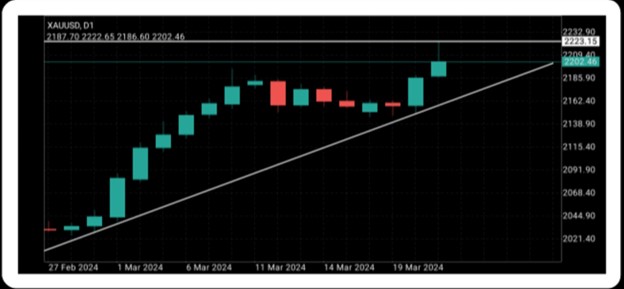
From a technical analysis standpoint, on the Daily Chart of XAUUSD, the price has been in an uptrend since February 29, 2024, starting at $2027.77 and reaching a peak of $2195.73 on March 8, 2024, serving as the initial resistance level. Subsequently, it retraced to $2149.70, where it encountered rejection by the trendline drawn from $2027.77.
Following the rejection, the price broke through the initial resistance level of $2195.73, which is now acting as support, with the current price hovering above it at around $2202.46, reaching an all-time high of $2223.15 on March 20, 2024.
If the price breaches the trendline downward, there is a higher likelihood of further downward movement in the price. However, if the trendline rejects the price, there is an increased probability of it ascending towards the resistance level. Should the resistance level be breached, there is an elevated likelihood of further upward movement in the price.
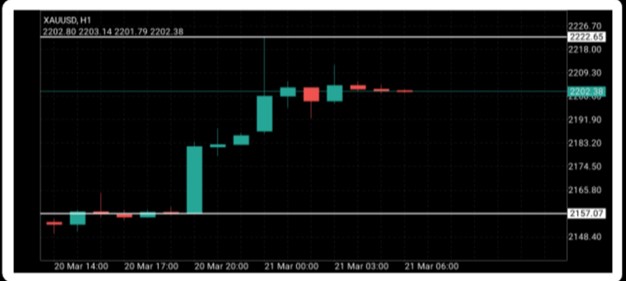
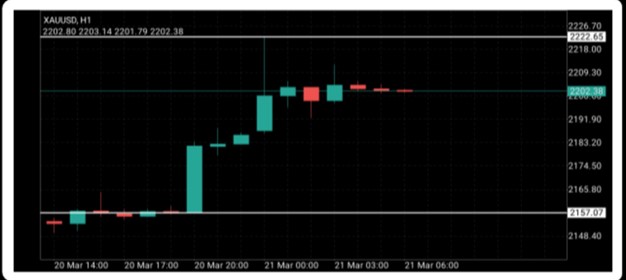
Based on the 1-hour chart of XAUUSD, the price has been consolidating within a range, with $2222.65 acting as resistance and $2157.07 as support.
If the support level is breached downward, there is a higher probability of further downward momentum in the price. Conversely, if the support level rejects the price, there is an increased likelihood of it ascending towards the resistance. Furthermore, if the resistance level is breached, there is an elevated probability of further upward momentum in the price.
Sources :
https://www.federalreserve.gov/
1HR Chart of XAUUSD from Metatrader 4
Daily Chart of XAUUSD from Metatrader 4


