PREVIOUS TRADING DAY EVENTS – 25 Sep 2023
The Ifo Institute’s business climate index was reported at 85.7, a decline from a revised August figure of 85.8 but above the 85.2 forecast.
The German economy is risking a second recession in a year after shrinking in the last quarter of 2022 and the first quarter of 2023.
“German businesses, as well as politicians and the entire economy, are gradually getting used to the idea that the economy is in for a longer period of subdued growth,” ING’s global head of macro Carsten Brzeski said.
“The Ifo [index]confirmed that the German economy is extremely weak,” Capital Economics senior Europe economist Franziska Palmas said.
Source: https://www.reuters.com/markets/europe/german-business-sentiment-worsens-september-ifo-2023-09-25/
______________________________________________________________________
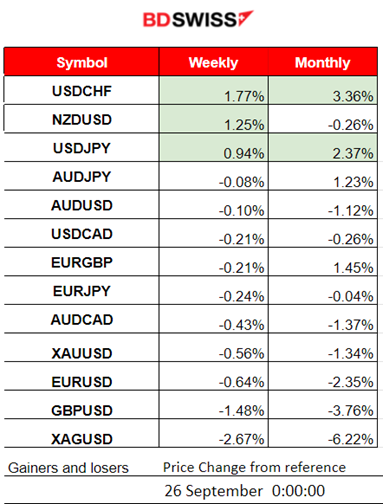
Winners vs Losers
USDCHF leads this week with 1.77% gains and it is also the top winner for this month with 3.36% gains so far.
______________________________________________________________________
News Reports Monitor – Previous Trading Day (25 Sep 2023)
Server Time / Timezone EEST (UTC+03:00)

- Midnight – Night Session (Asian)
No important announcements, no significant scheduled figure releases.
- Morning–Day Session (European and N. American Session)
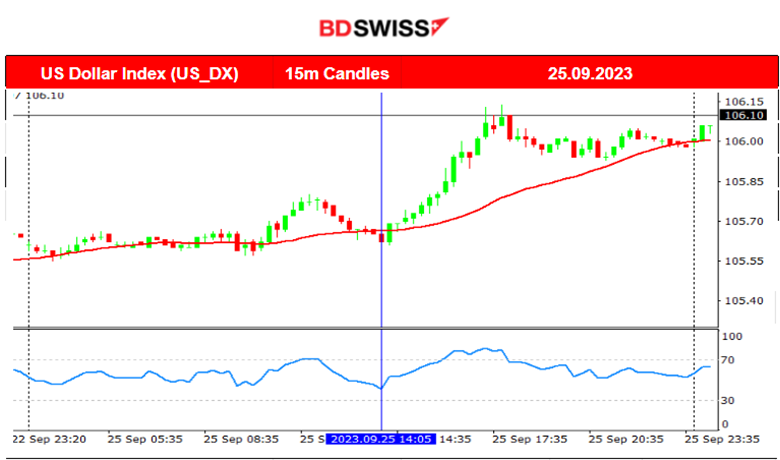
The result of the German ifo Business Climate Survey was reported 85.7, higher than expected but lower than the previous figure. No major shock was observed at that time. However, it is clear that volatility kicked in after that at the start of the European session bringing the EURUSD down.
General Verdict:
____________________________________________________________________
FOREX MARKETS MONITOR
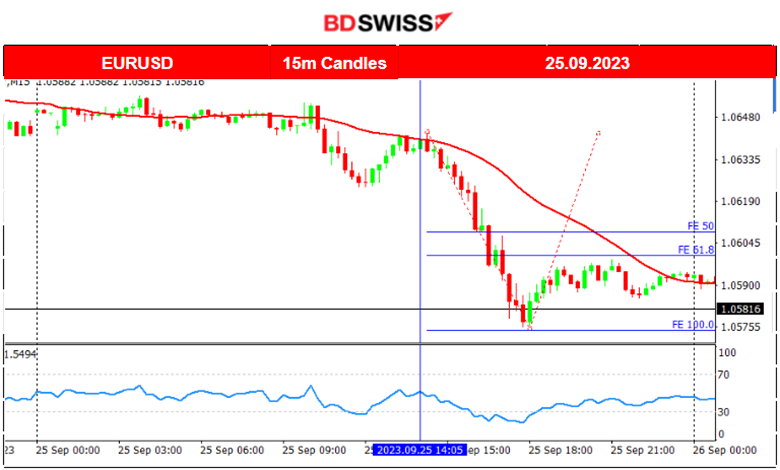
EURUSD (25.09.2023) Chart Summary
Server Time / Timezone EEST (UTC+03:00)
Price Movement
The pair experienced volatility during the European session moving downwards mainly because of UD appreciation. The pair moved rapidly just over 60 pips to the downside moving away from the 30-period MA and finding support at near 1.05740. It soon retraced steadily back to the 61.8 Fibo level and so did the mean.
___________________________________________________________________
CRYPTO MARKETS MONITOR
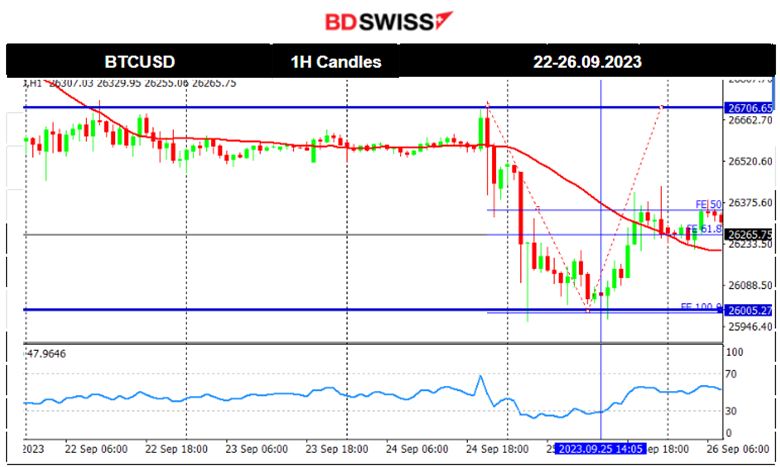
BTCUSD (Bitcoin) 4-Day Chart Summary
Server Time / Timezone EEST (UTC+03:00)
Price Movement
Bitcoin crashed on the 24th Sept and moved relatively rapidly towards the next important support at nearly 26000 amid a generally bearish sentiment among crypto traders. After testing this level several times, it finally retraced back to the 30-period MA where it currently settled until the next big move.
Crypto sorted by Highest Market Cap:
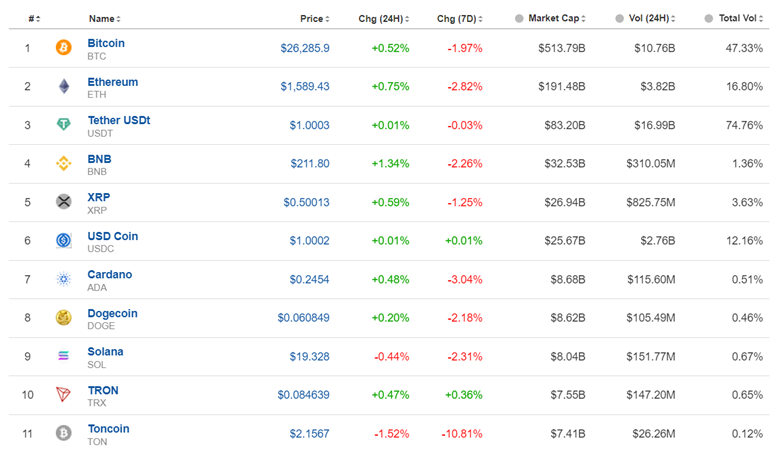
We have seen that the bearish sentiment actually affected almost all the above crypto assets. Looking at the 7 days column, it’s all red. Ton coin suffered -10.81% change so far. Bitcoin suffered almost 2%.
Source: https://www.investing.com/crypto/currencies
______________________________________________________________________
EQUITY MARKETS MONITOR
NAS100 (NDX) 4-Day Chart Summary
Server Time / Timezone EEST (UTC+03:00)
Price Movement
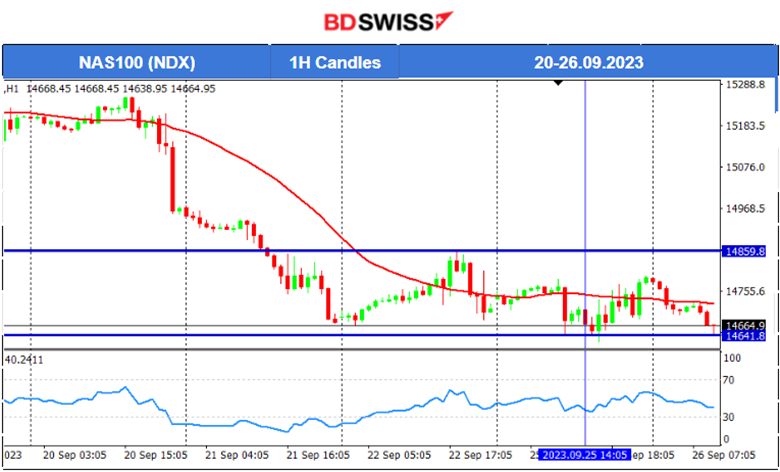
The USD experienced strong appreciation while the U.S. stocks lost significant value in general as per the chart. On the 21st of September, the index moved lower rapidly. This downward movement confirmed the downtrend. The index eventually retraced back to the 61.8 Fibo retracement level after it found strong support at near 14670. Other benchmark indices were following a downtrend as well with a similar price path the previous week. This week, however, a clear consolidation period takes place. NAS100 is going towards the downside currently and will probably test the support near 14640.
______________________________________________________________________
COMMODITIES MARKETS MONITOR
USOIL (WTI) 4-Day Chart Summary
Server Time / Timezone EEST (UTC+03:00)
Price Movement
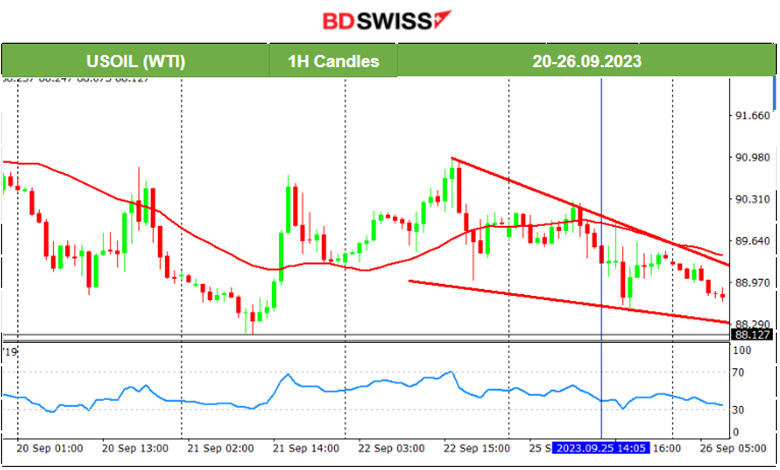
Crude was threatening with higher prices lately causing more issues for central banks in their fight to bring inflation down. Last week, it reached over the 90 USD/b psychological level and after some resistance to the upside, it eventually settled below that level. Currently, we notice a downward wedge formation with the price testing important support levels near 88.20. Breakout of that would lead the price rapidly downwards.
XAUUSD (Gold) 4-Day Chart Summary
Server Time / Timezone EEST (UTC+03:00)
Price Movement
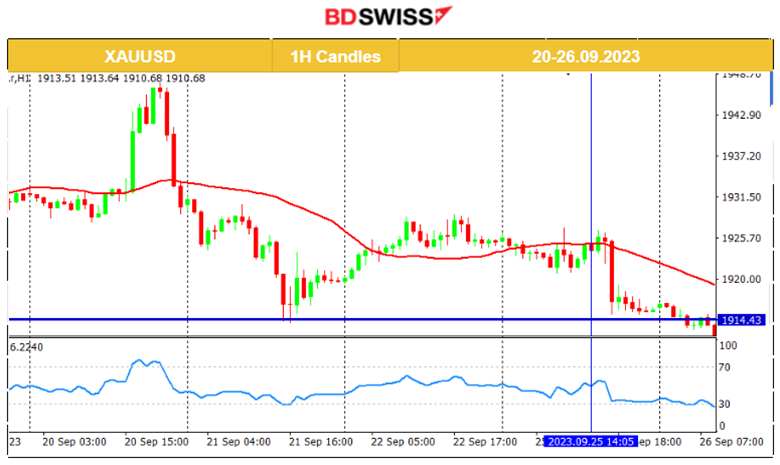
After the release of the Fed Rate decision, the USD weakened heavily and the Gold price dropped moving downwards towards the support near 1923 USD/oz. Later it further dropped to the support near 1914 USD/oz and retraced back to the 61.8 Fibo level where it settled. For the 22nd of September, Friday, Gold price moved sideways overall with no significant volatility closing at near 1925 USD/oz. On the 25th Sept, its price moved further to the downside. This could be the result of the recent USD appreciation. It is clear that the support near 1914 USD/oz is broken and this would lead the price further downwards.
______________________________________________________________
News Reports Monitor – Today Trading Day (26 Sep 2023)
Server Time / Timezone EEST (UTC+03:00)
- Midnight – Night Session (Asian)
No important announcements, no significant scheduled figure releases.
- Morning–Day Session (European and N. American Session)
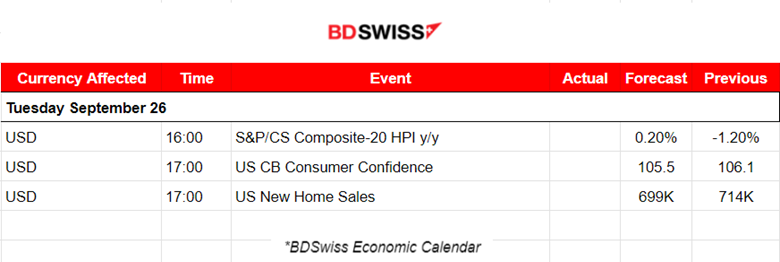
The CB Consumer Confidence for the U.S. is an important indicator of consumer spending. Currently, inflation is rising and when looking at the investors’ side, they are betting that interest rates will go higher. It is expected that the index result will be lower than the previous one. An intraday shock is possible for the USD pairs at that time. This could be the result of the New Home Sales figure as well which is reported lower.
General Verdict:
______________________________________________________________


