

Previous Trading Day’s Events (27.05.2024)
______________________________________________________________________
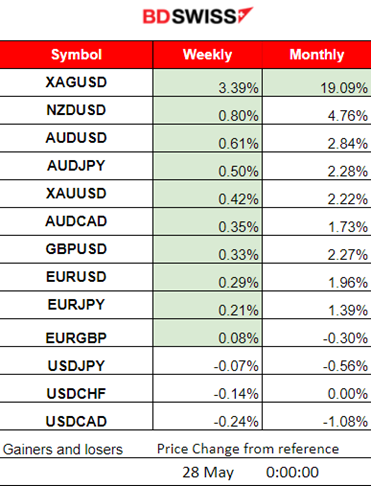
Winners vs Losers
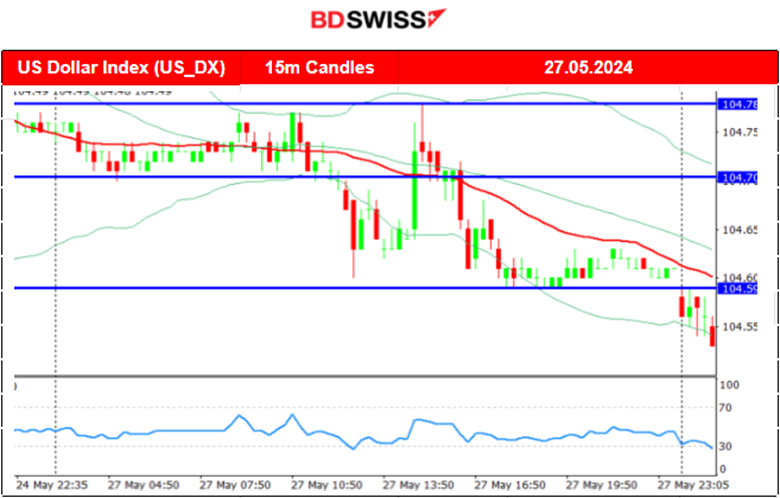
Silver remains high for the week and leads for this week with 3.39% gains. Gold moves away towards the bottom as it marks losses. The U.S. dollar starts to weaken significantly causing the USD pairs (USD as Quote currency) to remain high on the list.
 ______________________________________________________________________
News Reports Monitor – Previous Trading Day (27.05.2024)
Server Time / Timezone EEST (UTC+03:00)
- Midnight – Night Session (Asian)
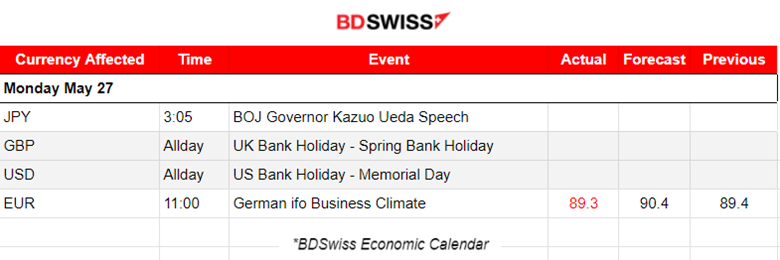
The Bank of Japan (BOJ) will proceed cautiously with inflation-targeting frameworks, according to Governor Kazuo Ueda, noting that some challenges are “uniquely difficult” for Japan after years of ultra-easy monetary policy. Ueda said Japan has “made progress in moving away from zero and lifting inflation expectations.” To achieve 2% inflation in a sustainable and stable manner, the BOJ “will proceed cautiously, as do other central banks with inflation-targeting frameworks,” he said.
- Morning – Day Session (European and N. American Session)
Memorial Day and Spring Bank Holiday: UK and US shares closed today.
German business morale stagnated in May, missing forecasts, putting a stop to three consecutive months of increases. The Ifo Institute said its business climate index remained constant in May at 89.3, compared with a reading of 90.4 forecast by analysts. No major impact was recorded in the market at the time of the release.
General Verdict:
 __________________________________________________________________
FOREX MARKETS MONITOR
EURUSD (27.05.2024) 15m Chart Summary
Server Time / Timezone EEST (UTC+03:00)
Price Movement
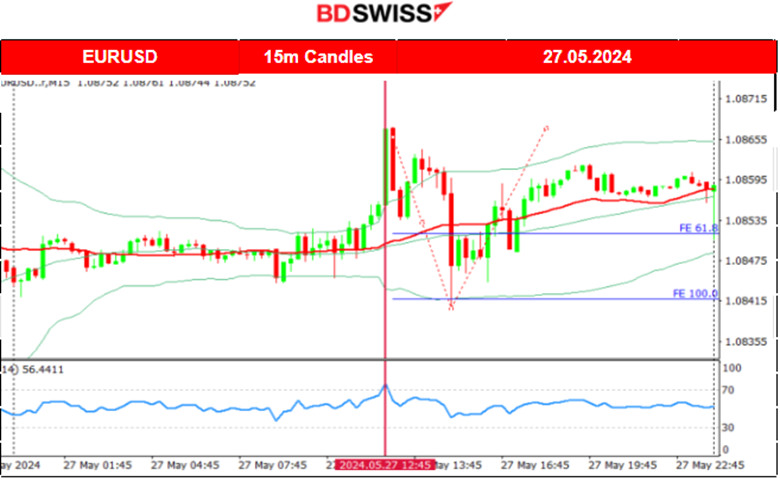
EURUSD was experiencing very low volatility during the Asian session and moved sideways. After the start of the European session, the USD started to depreciate greatly pushing the pair to the upside until it found resistance at 1.08670 before retracing. Driven by the USD, It eventually reversed fully and even crossed the 30-period MA on its way down until the support at near 1.08415 before it again saw a reversal back to the MA. It eventually continued to the upside but steadily and not significantly as the USD was slowly depreciating overall.
 ___________________________________________________________________
CRYPTO MARKETS MONITOR
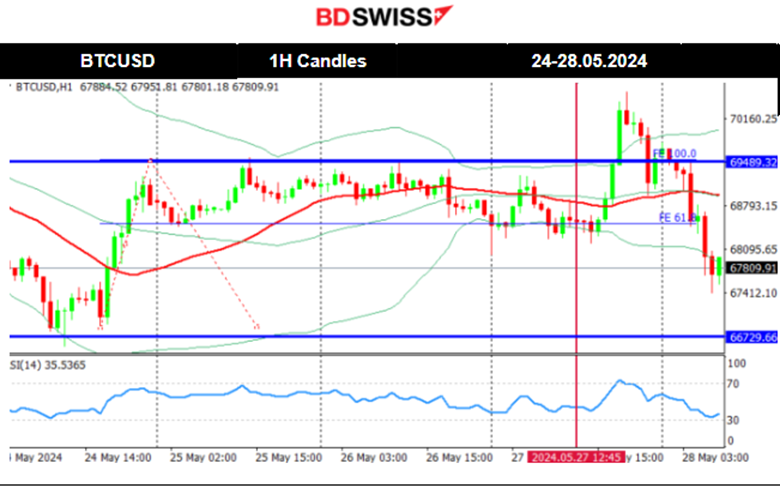
BTCUSD (Bitcoin) Chart Summary 1H
Server Time / Timezone EEST (UTC+03:00)
Price Movement
Bitcoin settled near 70K USD on the 22nd of May. That changed later with Bitcoin moving rapidly to the downside on the 23rd after 16:00. Many assets including stocks and commodities got affected negatively after that time. The price returned back and settled near the 67K USD level wiping out the gains since the jump on the 20th of May.
The price eventually jumped on the 24th of May and continued its upward movement until the resistance at near 69,600 USD. It retraced during the weekend when volatility levels lowered. After a period of consolidation during the weekend when the price experienced low volatility, Bitcoin saw a jump on the 27th of May reaching 70,6K but soon reversed heavily to the downside.
 Crypto sorted by Highest Market Cap:
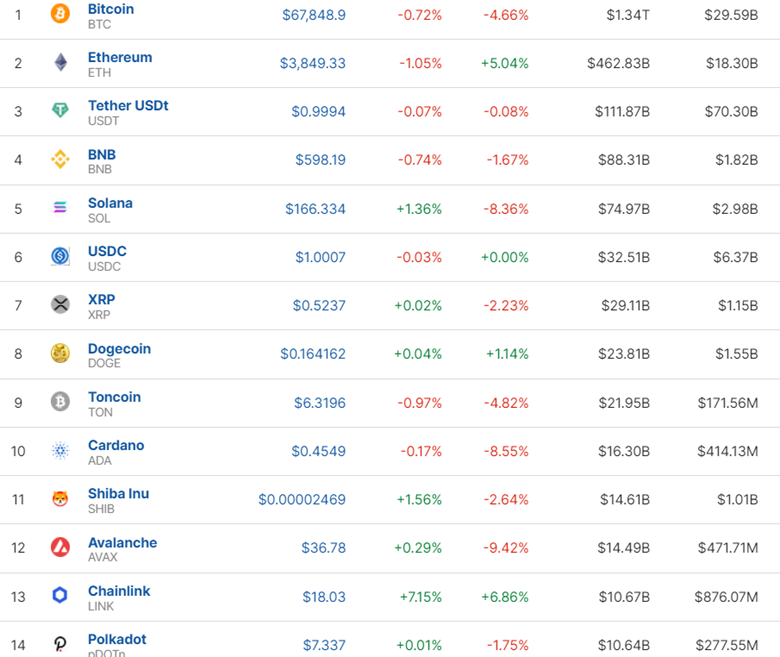
The market got a boost from the approval of ETH ETFs by the SEC. However, on the 27th it saw a retreat.
Sources:
https://www.investing.com/crypto/currencies
______________________________________________________________________
EQUITY MARKETS MONITOR
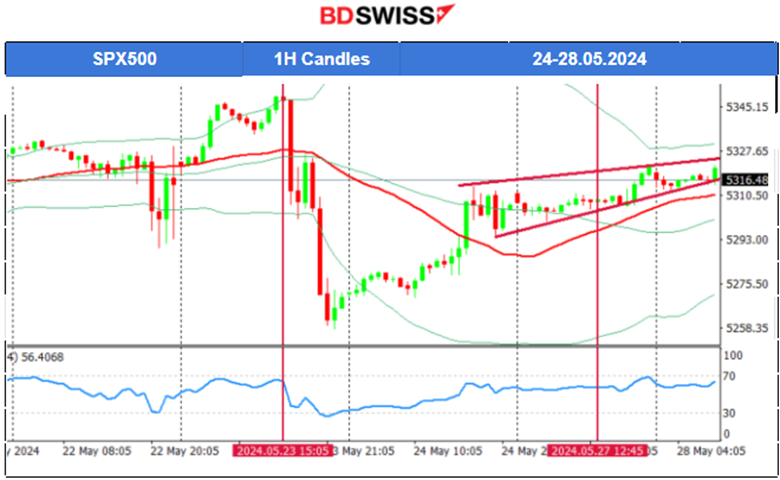
S&P500 (SPX500) 4-Day Chart Summary
Server Time / Timezone EEST (UTC+03:00)
Price Movement
The triangle formation that was highlighted in our previous analysis was broken on the 22nd of May and the index moved downwards to the support near 5,290 USD before a full reversal took place. This high volatility depicted on the chart was taking place during the FOMC meeting minutes release. All U.S. indices experienced a pre-market aggressive movement to the upside and broke the resistance at near 5,330 USD reaching only near the peak at near 5,350 USD. Then, after the stock market opening and the release of the U.S. PMI figures all indices dropped heavily on the 23rd of May. S&P500 reached support at near 5,258 USD before a strong retracement took place with an upward steady movement on the 24th of May. The index reached the 5,314 USD resistance that day before it retraced to the 61.8 Fibo level. On the 27th of May, it was a holiday in the U.S. and the stock market was closed. Indices did not experience much volatility, S&5P500 moved however slightly higher forming an upward wedge.
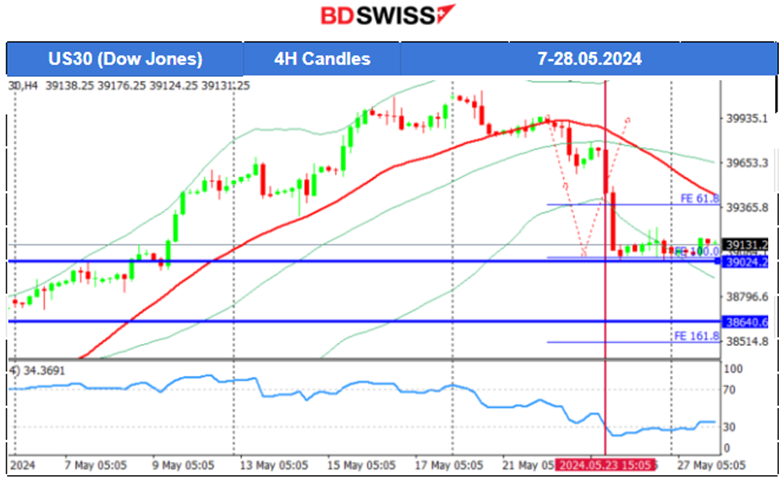
 Dow Jones (US30) 4-Day Chart Summary
Server Time / Timezone EEST (UTC+03:00)
Retracement opportunity. Target level 39,360 USD. The price now lies close to that important support area and it is expected that it will move away soon as the consolidation period is long enough, probably after today’s exchange opening. An alternative scenario would be to break that support and rapidly fall towards the next support target at near 38,640 USD.
 ______________________________________________________________________
COMMODITIES MARKETS MONITOR
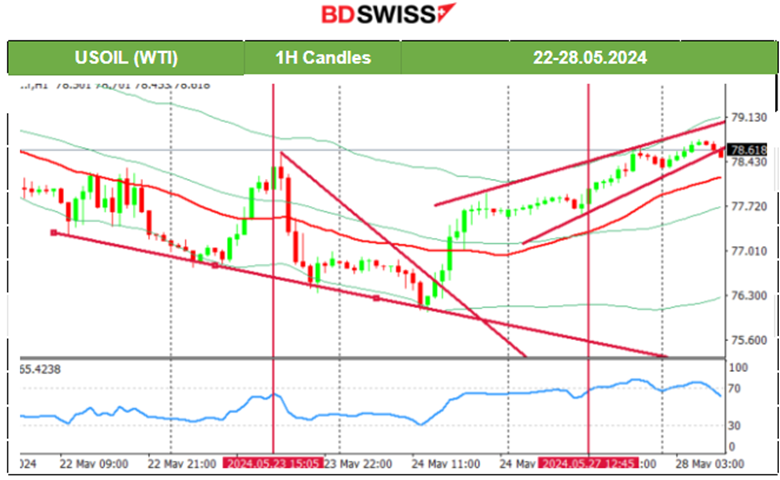
USOIL (WTI) 4-Day Chart Summary
Server Time / Timezone EEST (UTC+03:00)
Price Movement
The price jumped on the 23rd of May crossing the 30-period MA on its way up and indicating the possible end of the downtrend. However, that changed when the price experienced a sudden drop after the U.S. PMI release. The momentum was so strong that a new downtrend was created. The price broke an important support near 76.40 USD/b and sparked expectations for a further downward movement to the next support. On the 24th that support was at nearly 76 USD/b. After that, the price reversed to the upside, crossing the MA on its way up and reaching the resistance at near 77.90 USD/b. The RSI did not show strong bearish signals and retracement did not take place.
The price instead continued to move upwards aggressively. An extension to output cuts of 2.2 million barrels per day is the likely outcome, OPEC+ sources have said this month which raises expectations of a price increase.
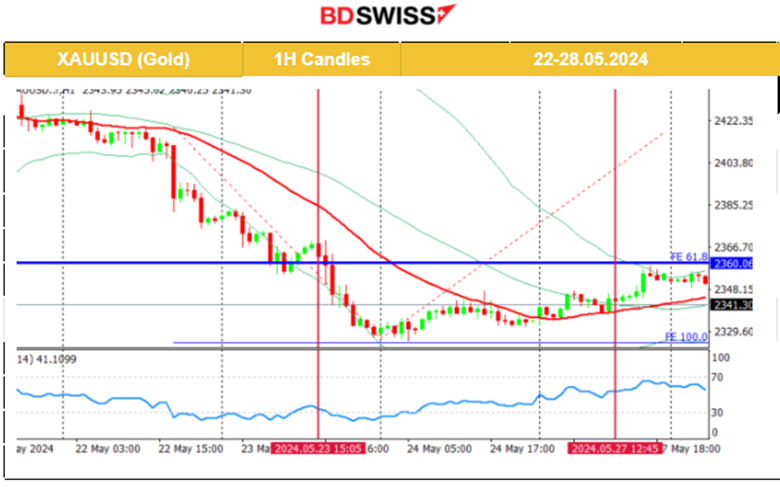
 XAUUSD (Gold) 4-Day Chart Summary
Server Time / Timezone EEST (UTC+03:00)
Price Movement
The support on the 22nd of May was broken and the price dropped heavily reaching the support at near 2,355 USD/oz. The downtrend continued until the price reached another important support at near 2,325 USD/oz on the 23rd of May and the potential for a retracement now is apparent with the target level at near 2,360 USD/oz. On the 24th of May, the price moved only slightly upwards but the potential for a further upward movement still remained as mentioned in our previous analysis. The price moved to the upside and completed the retracement to the 61.8 Fibo level and reached near the target of 2,360 USD/oz on the 27th of May.
 ______________________________________________________________
News Reports Monitor – Today Trading Day (28 April 2024)
Server Time / Timezone EEST (UTC+03:00)
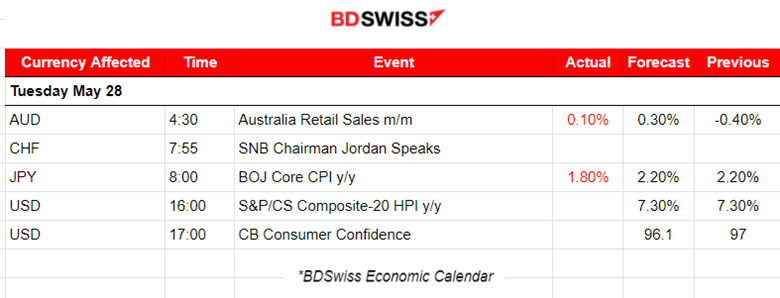
- Midnight – Night Session (Asian)
The April 2024 seasonally adjusted estimate for retail sales in Australia rose 0.1% month-on-month according to the report at 4:30. That figure caused no significant impact on the market. The Australian Dollar continued to strengthen against the U.S. Dollar for the third consecutive session on Tuesday, despite the softer retail sales figure.
At 8:00 the core CPI figure in Japan was reported lower at 1.8%, down from 2.20%. After the release, the JPY suffered depreciation. The USDJPY moved upwards more than 20 pips.
- Morning – Day Session (European and N. American Session)
The CB Consumer confidence figure for the U.S. will be released at 17:00. The figures have shown a continuous decline since the start of the year.
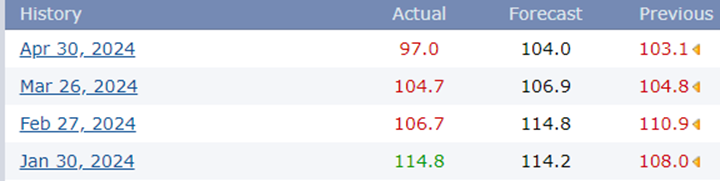
Confidence retreated further in April as consumers became less positive about the current labour market conditions and more concerned about future business conditions, job availability, and income. Elevated price levels, especially for food and gas, dominated consumer concerns. Further decrease is expected and the USD pairs could be affected moderately at the time of the release.
General Verdict:
______________________________________________________________


