Rates as of 05:00 GMT
Market Recap
That didn’t last long! After a one-day rally, stocks plunged further yesterday. The S&P 500 was down 6.3% after trading down 9% at one point and triggering the fourth market-wide circuit breaker in two weeks. It’s indicated -2.4% this morning, which as things go recently isn’t bad.
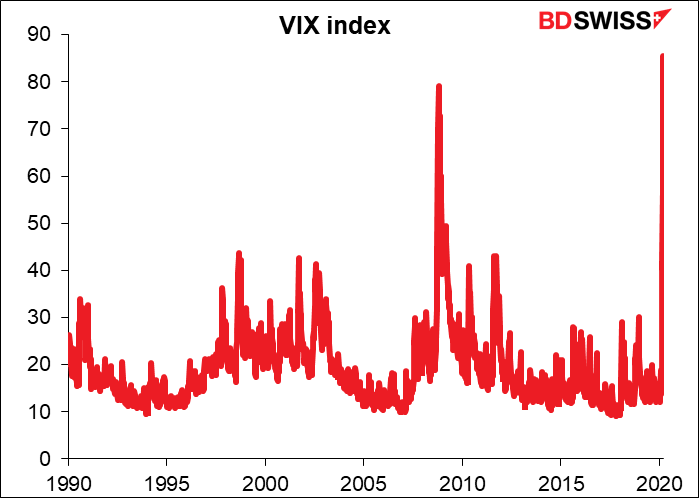
The volatility is tremendous. The VIX index, Wall Street’s “fear” index, hit a record high yesterday of 85.47 during trading hours. It was just a few months ago that I wrote a big article explaining why vol in the FX market had crashed to record low levels and was likely to stay there.
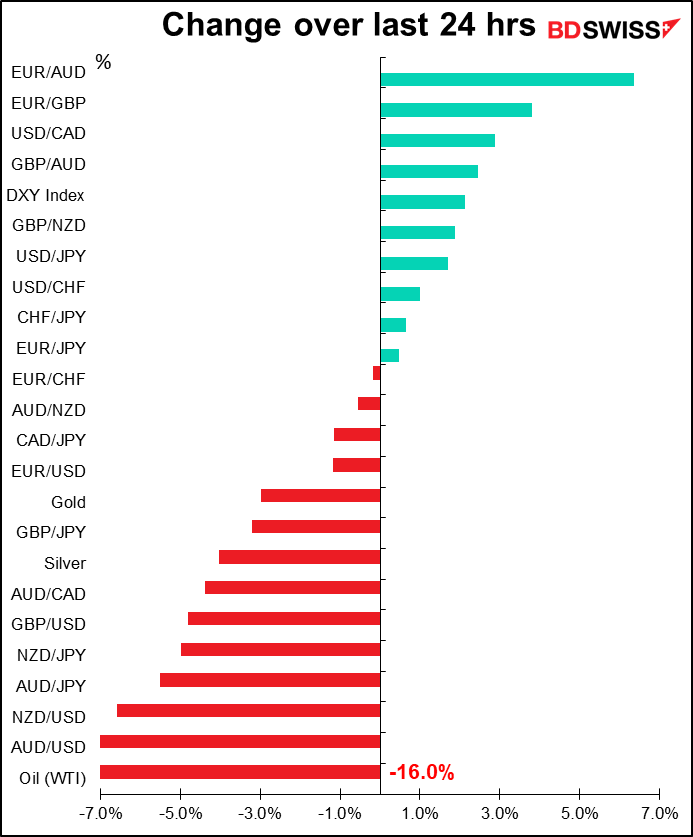
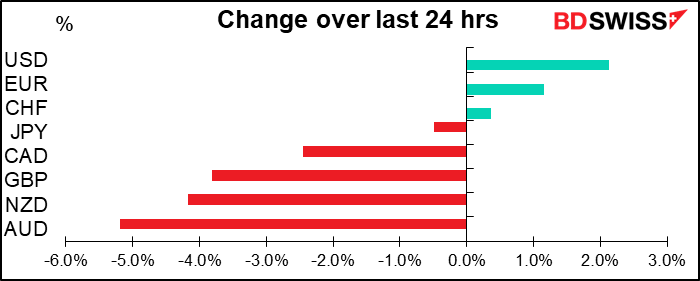
There were two main currents in the FX market yesterday: dollar strength and sterling weakness.
On a nominal basis, the dollar hit a record high vs emerging market economies, although it’s still well below its 1985 pre-Plaza Accord peak vs the major industrial countries.
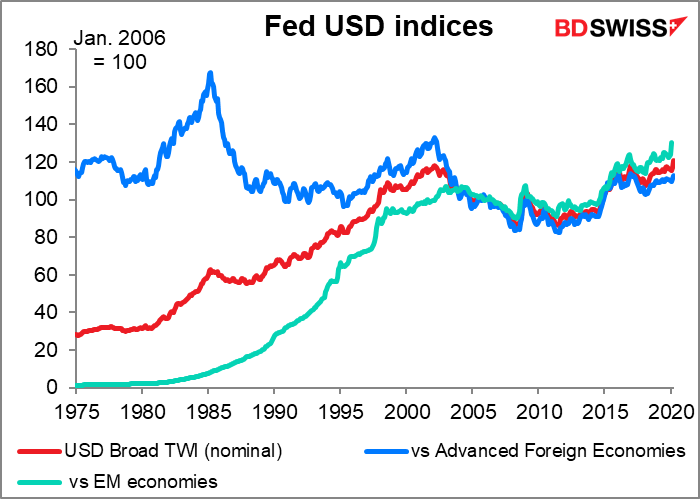
The main reason for the dollar’s strength, oddly enough, seems to be the financial stress. Market liquidity is thinning out and there are severe funding concerns..
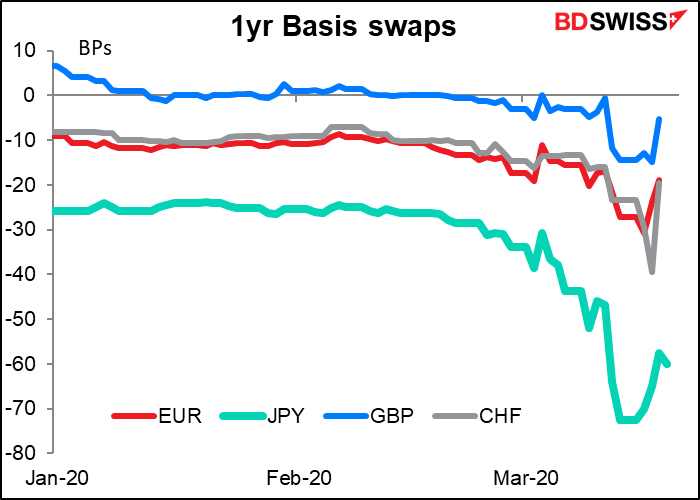
Against this background, companies around the world are drawing down their bank credit lines and trying to secure enough dollars. This puts particular strain on banks outside the US, which then have to go into the FX market to obtain dollars through swap arrangements. The Fed lowered the interest rate on swaps with other central banks, but this hasn’t fixed the problem entirely. Furthermore, the Fed only has swap arrangements with a few major central banks, meaning that most EM currencies are left to their own devices.
We’ve seen some incredible dislocations in the financial markets indicative of panic and a freezing of even major markets. The Ishares Core US Aggregate Bond Fund, an ETF that tracks the Bloomberg Barclays US aggregate bond index (a representative sample of US bonds), is now trading at an incredible 4.4% discount to net asset value. This is a huge ($65.2bn) fund, one of the biggest. The discount implies that a) people are desperate to get their money out of even bonds, which are supposed to be the safe-haven investment, and b) no one really knows where net asset value is.
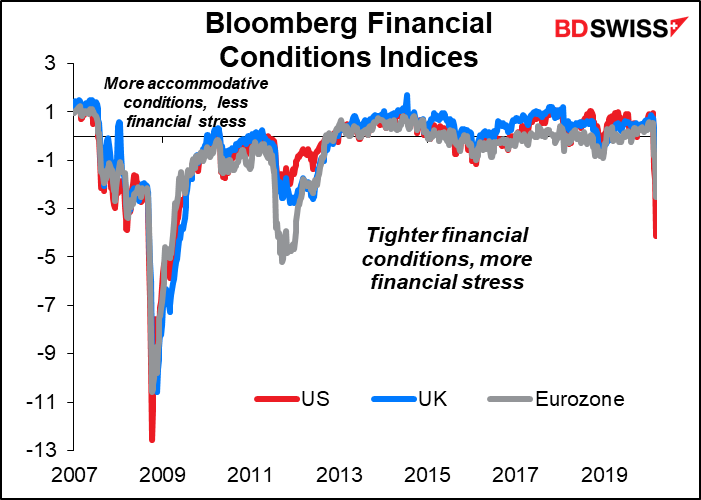
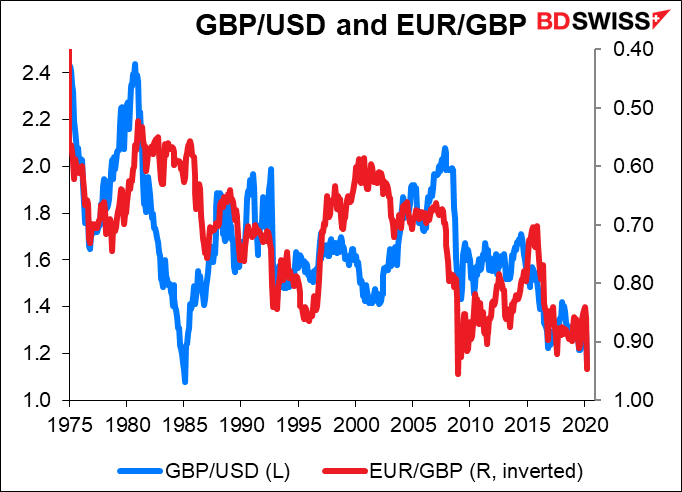
The tightening of financial conditions has hit sterling especially hard, perhaps because of the UK economy’s dependence on the financial sector and its key role in the global financial markets, making its economy particularly vulnerable to a financial market melt-down. Furthermore, the country has large twin deficits and low real yields, making it dependent on capital inflows – which are not likely right now as everyone tries to de-risk their portfolios. Cable is now back to levels last seen during the peak USD time of 1985, while EUR/GBP at 0.947 is nearing the record high of 0.976 set on 30 December 2008.
The big move of the day though was in AUD, which collapsed following an emergency meeting of the Reserve Bank of Australia (RBA). The RBA cut its cash rate to 0.25%, the lowest that it said it would go, and implemented Japan-style “yield curve control.” It declared a target for the 3-year Australian government bond of around 0.25%. It will also purchase semi-government securities to “address market dislocations.” It also introduced a term funding facility for banks, with particular support for credit to SMEs. At the same time, the government announced a program to help smaller lenders to support consumers and small businesses.
AUD was down more at one point, but on a conference call RBA Gov. Lowe said the Bank was prepared to intervene in the FX market if necessary, just as it was ready to intervene in the bond market, if conditions become disorderly. He didn’t say that he was willing to intervene to defend any levels, but just the fact that he’s willing to get involved helped to support the currency a bit.
The RBA move outweighed the impact of a surprise fall in the country’s unemployment rate to 5.1% from 5.3%, which ordinarily would’ve been a definite plus for the currency. However it’s clearly old hat: at the same time, Quantas furloughed most of its 30,000 workforce and stopped all international flights. That low unemployment figure won’t last long.
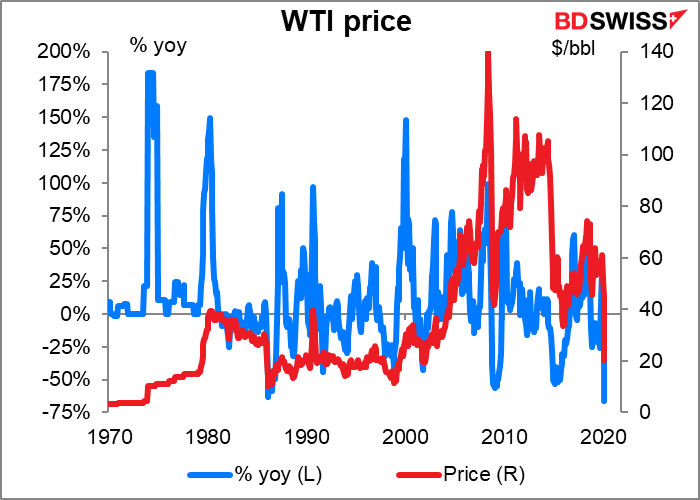
Oil continued to fall, dropping to the lowest level since 2003. If Saudi Arabia continues with plans to up its production to 12.3mn barrels a day (b/d) from its recent average of 9.8mn b/d, it seems likely that the price will continue to decline.
By the way, I recently pointed out that the gold/silver ratio was the highest in over 5,000 years. Well, this isn’t quite such a long-term record, but as far as I can tell, this has been the fastest yoy decline in oil prices ever. “Ever” in this case is back to 1946, which is all the data I have. Looking at a year-on-year basis (end-month data), West Texas Intermediate (WTI) is now down 66.1% yoy, beating the 63.2% decline in March 1986. I’m sorry, I can’t remember what was happening in March 1986 to send oil prices crashing then, but I can tell you one thing: I don’t remember being scared of dying from it back then.
Today’s market
Recently I’ve had to write about indicators that weren’t going to be important, because no one is paying attention to the indicators. At least today I don’t have to write a lot about it.
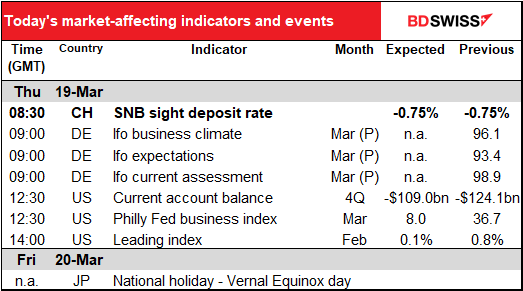
The Information und Forschung (Research) Institute (Ifo) has sprung a preliminary set of its business climate survey on us. This is a monthly survey of around 7,000 firms in manufacturing, construction, wholesaling and retailing. Usually it comes out at the end of the month – the final version is scheduled to come out on the 25th – but they apparently decided to have a preliminary estimate this month. That’s why there are no forecasts – everyone was caught unawares. I asked a reporter who covers the statistics about it and he said it was just a one-off because of the virus.
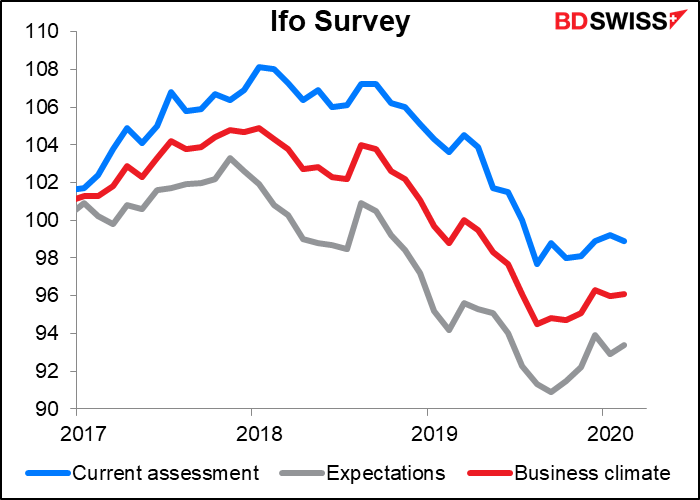
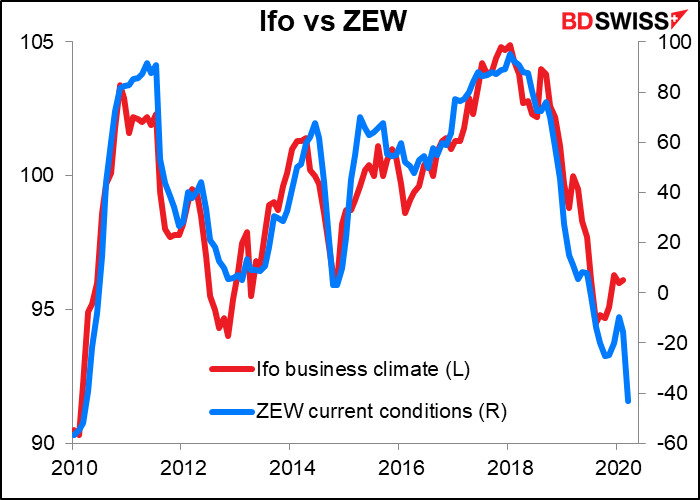
The ZEW index for the month, which tends to move along with the Ifo index, plunged during the month. I suspect the Ifo is expecting something similar for their index, too.
The preliminary Markit Purchasing Managers’ Indices (PMIs) for Germany come out on the 24th, a day before the Ifo indices. If I were the Ifo, I’d keep doing this, because it would capture some of the headlines away from Markit.
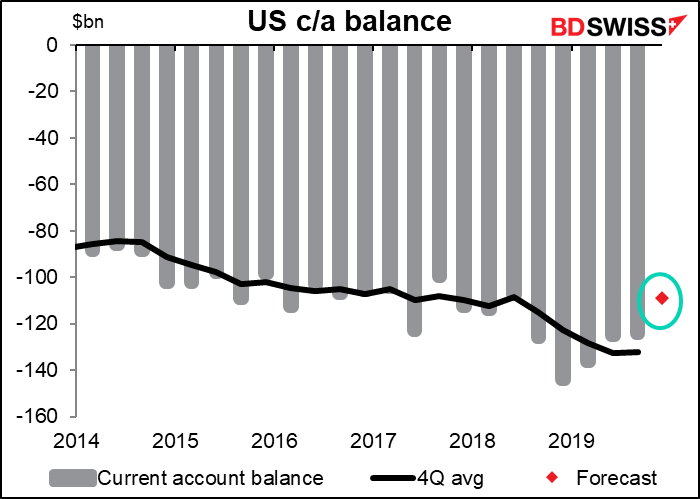
The quarterly US current account is just kind of FYI. I don’t think it’s market moving in the best of times. What it does show – and is expected to continue to show – is that the current account deficit is continuing to narrow. This is probably due to a large degree to trade in oil – US oil imports have fallen as shale oil production increased. The deficit can be expected to narrow further as the counterpart to a falling financial + capital account surplus, as foreign central banks run down their foreign exchange reserves to fund emergency measures and, in the case of oil producers, to cover budget deficits. Over the long term this should be good for the dollar, but I doubt if it will have much market impact today.
Above I mentioned the big drop in the ZEW index in March. You should’ve seen the big drop in the Empire State manufacturing index!!! It fell 34.4 points, from +12.90 to -34.40 (was expected to be +4.90, whatever “expected” means nowadays).
With that in mind, we face today’s Philadelphia Fed business outlook survey with some trepidation. The consensus “forecast” is for it to fall to 8.0 from 36.7. That would put the gap between the two at -29.5. That’s big, but not the biggest, which was -33.6 in May 2017. On average the difference between the two is ±8.6 points.
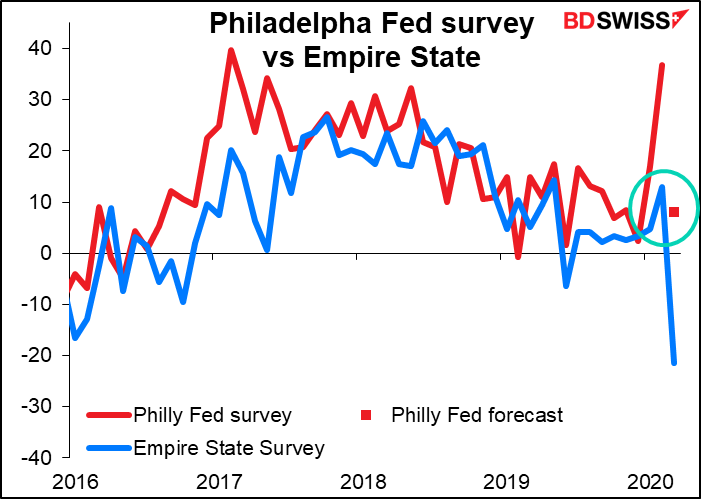
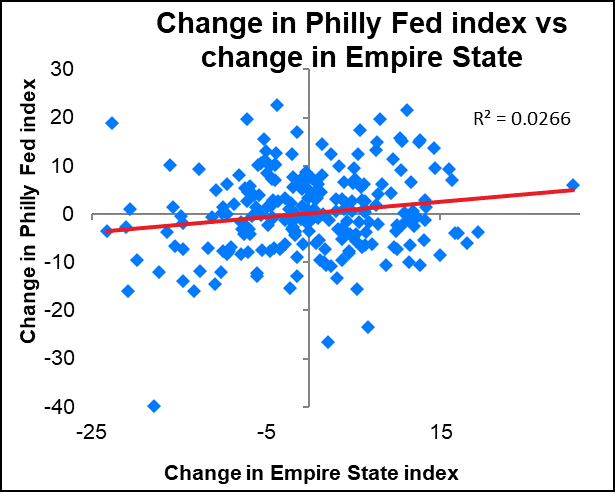
As you can see, there isn’t that much correlation between the month-to-month change in the two indices, even though the regions they cover are right next to each other. So I guess it is possible that the Philadelphia region could be doing much better than the New York region. However it is unusual for the Philly Fed index to be positive while the Empire State index is negative – that’s only happened 15 out ot 54 times, ie 28%. Personally, I wouldn’t be surprised if the index missed expectations, which could be negative for the dollar, if anyone is watching.
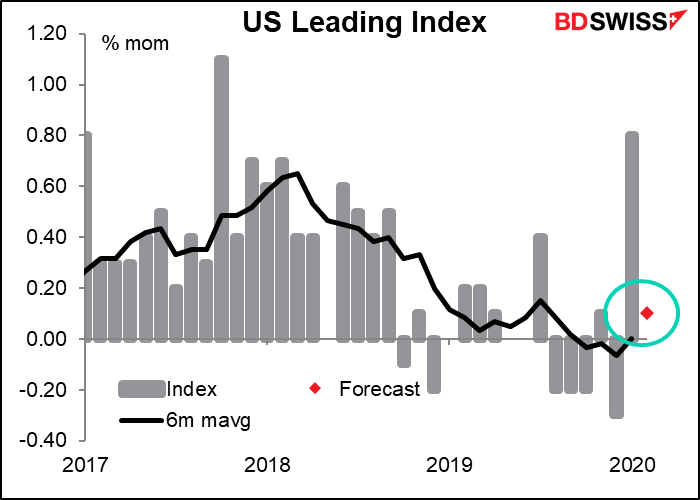
The US leading index…I’m not sure how well it’s going to lead this month, when there’s such a huge discontinuity in the data.