Rates as of 04:00 GMT
Market Recap
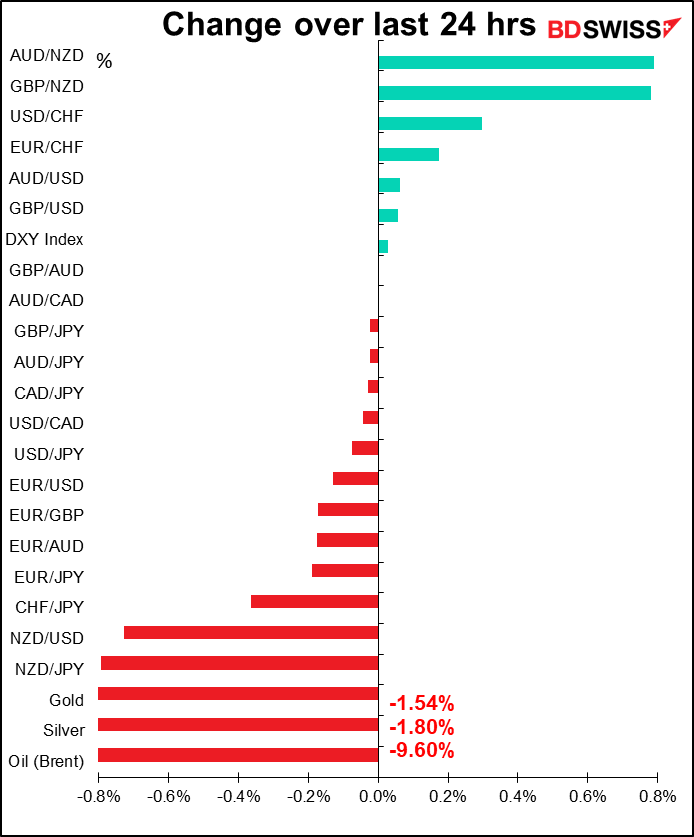
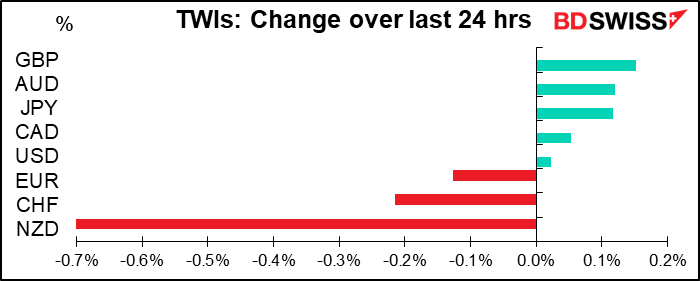
FX rates were relatively stable – a higher close on Wall Street had little carry over into Asia this morning, where stocks were mixed with only modest gains. In the absence of any strong “risk on” or “risk off” mood, most currencies barely budged, at least by recent volatile standards.
The only exception was NZD, which had been weakening for much of the European and US days and then got hit during NZ time this morning after Westpac forecast that the Reserve Bank of New Zealand (RBNZ) would lower its cash rate to -0.5%. Personally, I’m skeptical of this. When it cut rates to 0.25 bps last month (16 March), the RBNZ said, “…should further stimulus be required, a Large Scale Asset Purchase programme of New Zealand government bonds would be preferable to further OCR reductions” (which was in fact implemented a few days later on 23 March). The minutes of the meeting noted that “Staff also advised that an OCR of 0.25 percent was currently the lower limit, given the operational readiness of the financial system for very low or negative interest rates.” Westpac also forecast that the RBNZ would double its LSAP program to NZD 60bn a year at its May meeting, which I agree is indeed possible.
The market also disagrees about negative rates – the Overnight Index Swaps (OIS) market is forecasting a possible decline to 0.05% by November, but not negative rates.
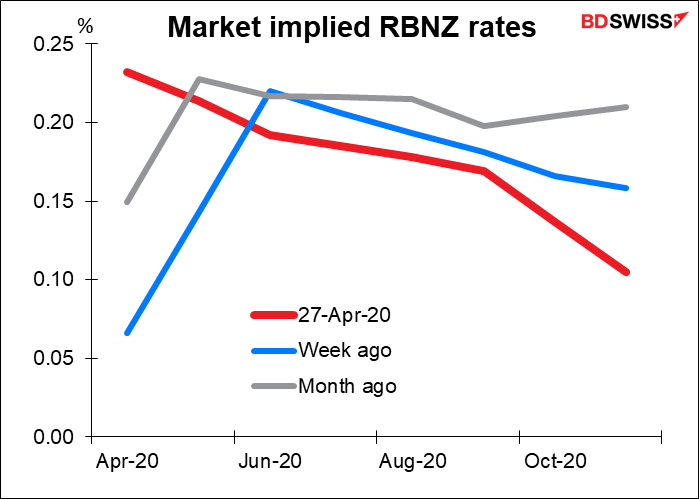
I think this move could’ve been just a reaction against the big jump in NZD the previous day – people may have taken profits on that move, or decided it was overdone. In that case, I think there could be a similar reaction to this move and it could be unwound during today’s market.
Oil continued to decline despite news from several countries (Saudi Arabia, Kuwait, Algeria and Nigeria) that they would start complying with the May OPEC+ output reductions earlier than scheduled. The move underscores just how serious the supply glut is.
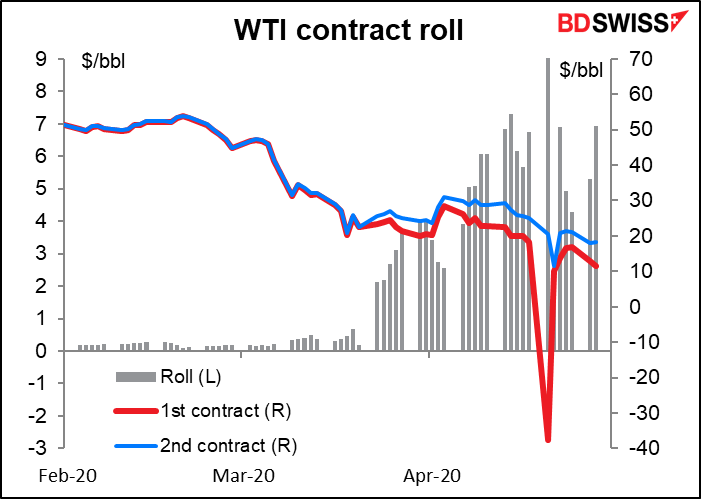
Meanwhile, the US oil market is being distorted by The United States Oil Fund LP, the biggest oil exchange-trade fund (ETF) in the US. The enormous ($3.6bn) fund began selling all of its holdings in the June WTI contract and moving them to contracts between July and June next year, because of new limits that the regulators and its broker have imposed. This selling has distorted the market as other market participants move to take advantage of the inevitable flows. As a result, the WTI front contract roll – the difference in price between the nearest contract (now June) and the next one (July) is still fantastically wide at $6.94. Usually it’s a matter of pennies. During all of 2019 for example it averaged +$0.09, with a normal range of ±$0.19. The total range for 2019 was from a low of -$0.29 to a high of +$0.50. Open interest in the June contract is now slightly lower than open interest in July, even though the June contract is still the most active contract. The result of these distortions is that the WTI contract is not a valid indicator of where oil is actually selling at this time. The Brent contract, which is cash settled, is a better indicator. But even there, the June-July roll is now $3.27, vs last year’s average of -$0.56 (normal range -$1.01 to -$0.11).
The move down in oil hit NOK and RUB but not CAD that much.
Eurozone peripheral spreads continued to narrow, especially Italy after Friday’s decision by Standard & Poors’ to keep their rating on the country unchanged. But it didn’t help EUR that much.
By the way, yesterday I said that the Bank of Japan’s move to lift the limit on its Japanese government bond purchases was meaningless, because its actual purchases – JPY 14tn a year – are so far below the existing limit of JPY 80tn that there was no need to lift it. There is one possible scenario in which it’s meaningful however – that is if the Japanese government decides to issue a whole lot more bonds. Then the BoJ would be able to buy them up without hitting up against this limit. The BoJ alluded to this possibility in the accompanying statement when it said, “In a situation where the liquidity in the bond market remains low, the increase in the amount of issuance of JGBs and T-Bills in response to the government’s emergency economic measures will have an impact on the market. Taking this into account, the Bank will conduct further active purchases of both JGBs and T-Bills for the time being, with a view to maintaining stability in the bond market and stabilizing the entire yield curve at a low level.” What this amounts to is a blank check for the government to issue more bonds to finance the recovery. Whether the government makes use of this or not is another question.
Today’s market
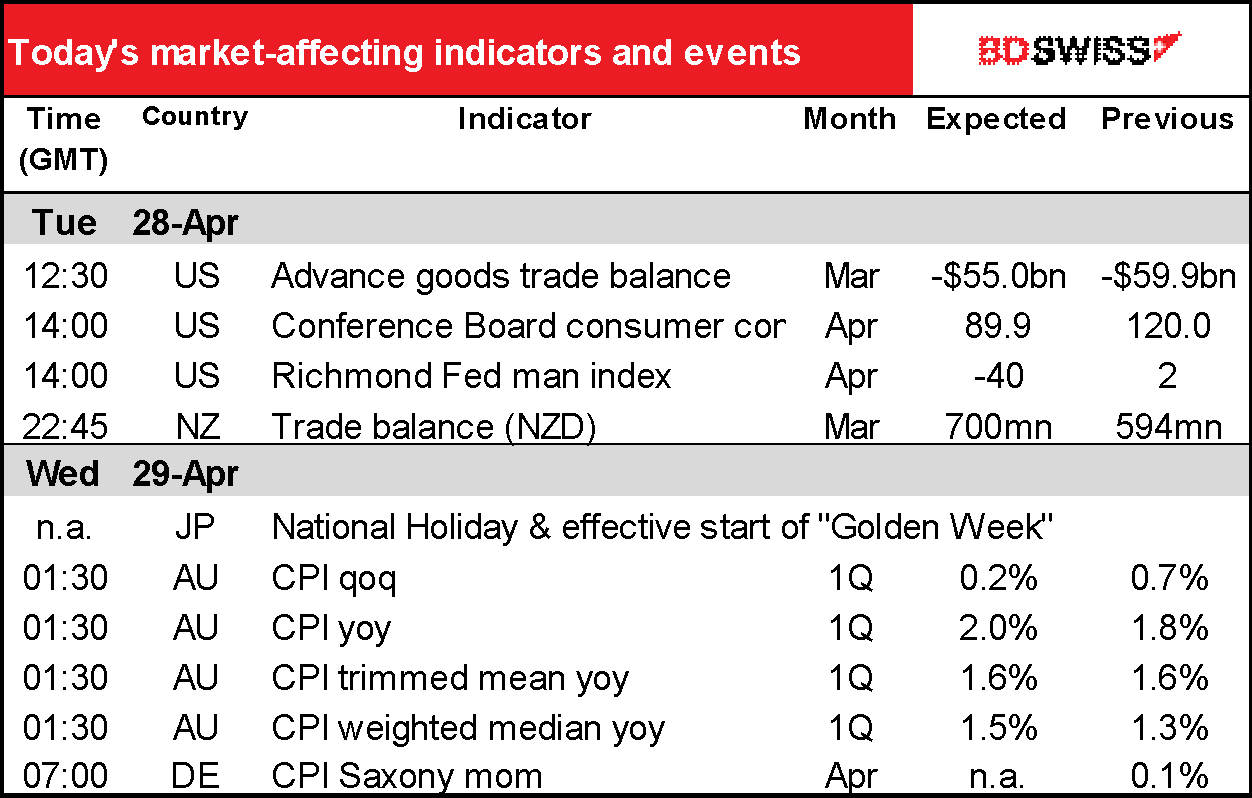
Nothing that stunning in the indicator world today.
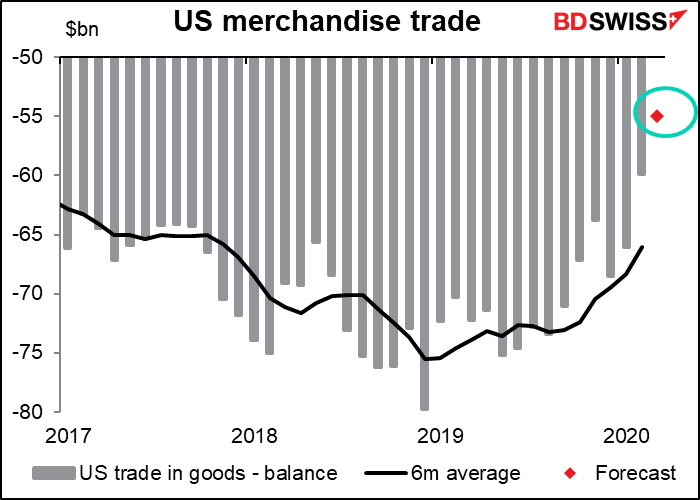
The US merchandise trade deficit is expected to continue to narrow. This is because imports are falling faster than exports. My guess is that this reflects the slowdown in US retail spending and in industry, which is dampening imports, while US exports of agricultural products continue unabated. For example, China’s exports were down 6.6% yoy in March while imports were down only 0.9%. Japan’s exports were down 12% yoy while imports were down 5%. Oil prices if anything would be a small negative here because the US is a net oil exporter.
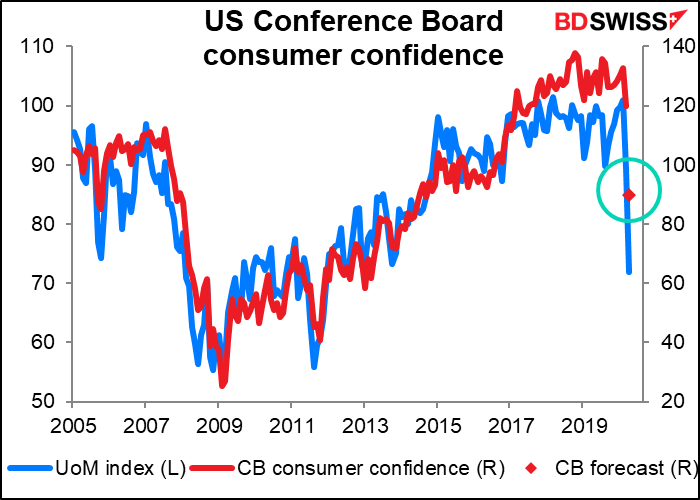
The Conference Board measure of US consumer confidence is expected to plunge, but not that badly when compared with the University of Michigan’s consumer sentiment index. I’m particularly surprised because the Conference Board measure is more heavily weighted towards the labor market, while the Michigan methodology places more emphasis on longer-term macroeconomic expectations. Neither is yet where they stood during the dark days of the 2008/09 recession, which is amazing to me – I would think a deadly virus straight out of a horror movie would be much more frightening than a bog-standard financial crisis like what comes along every decade or so. (It is to me, I’ll admit.) But maybe people have hope that if they just drink some Clorox or fish tank cleaner like Trump suggests they’ll be OK. Or that a vaccine will be found to cure the virus, whereas admittedly in 2008/09 it really looked like we were teetering on the edge of a financial black hole.
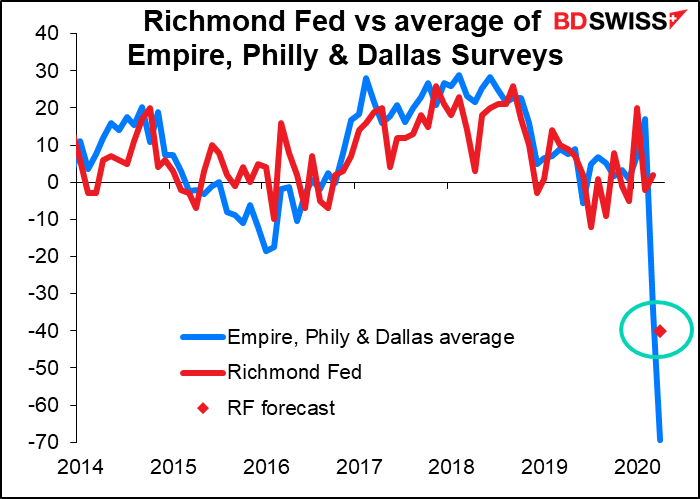
Next up is the Richmond Fed survey. I’m not sure how closely the market watches it, but investors certainly should: my research shows that among the five regional Fed surveys, it’s the best correlated with the Institute of Supply Management (ISM) manufacturing survey, which is what people are trying to forecast. (It doesn’t have much power at explaining the Markit manufacturing PMI however – the only one that’s good at that is the Empire State survey.) All the Fed indices have been tanking, which is only to be expected.
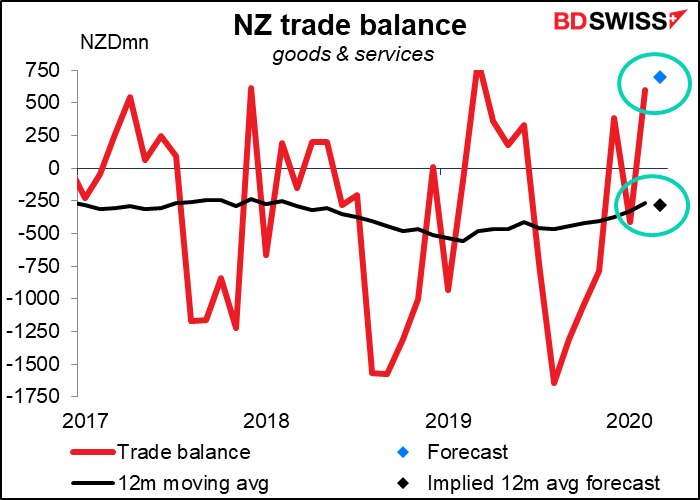
Overnight, New Zealand trade surplus is expected to rise a bit. The figures aren’t seasonally adjusted, so I prefer to look at the 12-month moving average. Actually, that would show a slightly wider deficit, but nothing major. New Zealand’s mostly agricultural exports are probably holding up well, because after all, lockdown or no lockdown, people still have to eat (and drink, too. Maybe even more than usual.)
It’s a holiday in Japan today. Japan has the most public holidays of any country that I know of (19 national holidays, compared to 11 in the US, eight in Britain and only five in Germany). When I lived there, I would ask people what the holiday was but most of the time no one would have any idea. This one is a perfect example. It’s “Showa Day.” It used to be Emperor Showa’s Birthday, but then Emperor Showa died and they got a new emperor with a different birthday. But it was so convenient to have a holiday on this day, the Wednesday before Golden Week (a week full of holidays) starts, so you could get an extra couple of days on your Golden Week holiday easily, that they just kept it as a holiday. So what do the Japanese do on Showa Day? Go to a show? Take a “showar”? Go “showapping?” This year, just stay home. Like yesterday. Like tomorrow.
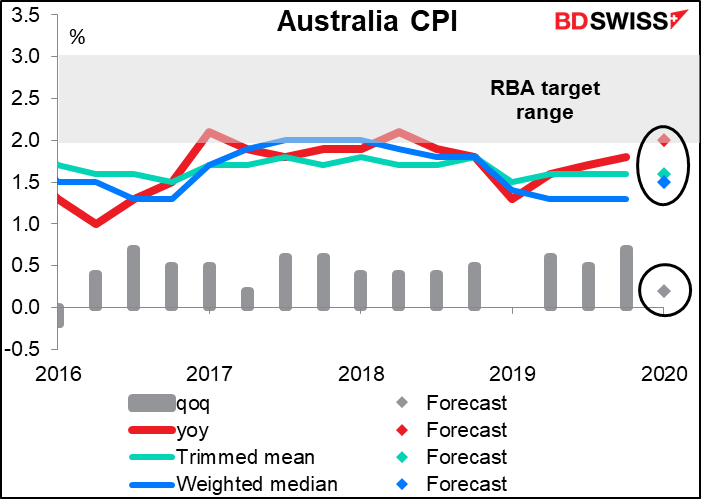
The Australian CPI is normally a Very Big Deal, because it’s of course important for monetary policy and it only comes out quarterly, so it’s valuable and rare. But Reserve Bank of Australia (RBA) policy is on hold for the indefinite future, so what does it matter?
On the one hand, the Reserve Bank Board’s members think the Cash Rate is “now at its effective lower bound” and that they have “no appetite for negative rates.”
On the other hand, it’s likely to be “a couple of years” before they start raising rates. RBA Gov. Lowe recently said he expects the unemployment rate to “remain above 6% over the next couple of years” and headline inflation “to remain below 2% over the next couple of years.” (See his speech from 21 April, An Economic and Financial Update.) Meanwile, the RBA has repeatedly pledged not to increase rates “until progress is being made towards full employment and it is confident that inflation will be sustainably within the 2–3 per cent target band.” (They estimate full employment to be around 4 ¾% unemployment.) In other words, no rise in rates is likely for “the next couple of years.”
In that case, the inflation data won’t be of any use until it starts to drift back into the 2%-3% range, which as we’ve heard is not likely to happen for…”a couple of years.”
