

PREVIOUS TRADING DAY EVENTS –09 Nov 2023
Unemployment benefits fell 3K to a seasonally adjusted 217K for the week ended Nov. 4 from an upwardly revised 220K in the prior week. The claims data adds to the case for the U.S. Federal Reserve to keep interest rates on hold for now, economists said.
“The claims data are consistent with a job market that is cooling enough to keep rate hikes off the table for now, but still too strong to make rate cuts a consideration any time,” Nancy Vanden Houten, lead U.S. economist at Oxford Economics, said in a note. “The Fed needs to see enough softening of labour market conditions and wage growth to be persuaded that inflation is on a sustainable path back to 2%.”
Inflation has fallen significantly to 3.4% but has made little further downward progress recently. The Fed meets once more this year, in mid-December, and interest rate futures markets reflect less than a 10% probability that policymakers will raise rates then, according to CME Group’s Fed Watch tool.
______________________________________________________________________
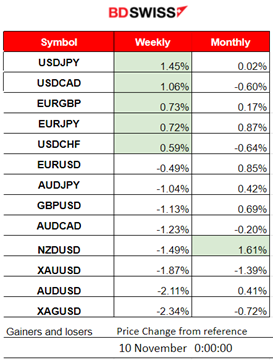
Winners and Losers
News Reports Monitor – Previous Trading Day (09 Nov 2023)
Server Time / Timezone EEST (UTC+02:00)
- Midnight – Night Session (Asian)
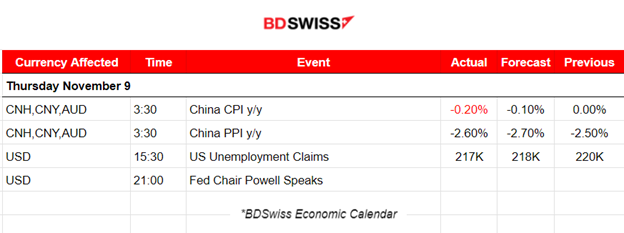
Inflation data for China show that it re-entered disinflationary territory in October. Both consumer (CPI) and producer (PPI) inflation contracted. The CPI inflation shrank at an annualised 0.2% in October, in line with expectations of a negative figure, and worsened from the 0% reading seen in September. No major shock was recorded at that time.
- Morning–Day Session (European and N. American Session)
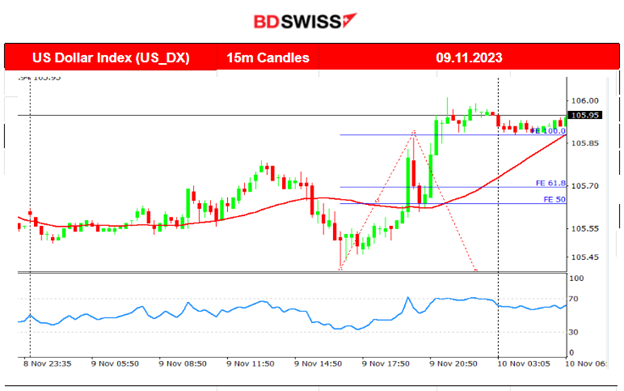
The jobless claims for the U.S. were reported lower than expected. That was quite a surprise since all economic reports suggest that the elevated interest rates affect the labour market negatively. The USD was affected after the release by depreciating against other currencies during that time, however the figure’s impact was not so great.
The dollar strengthened during Fed’s Powell comments.
Powell Speech important comment:
“The fed-funds rate is around 5.3% and if expected one-year ahead inflation is around 3%, that implies a real rate above 2%. He says that’s “well above” mainstream estimates of the neutral rate, and policy is “probably significantly restrictive”
General Verdict:
 ____________________________________________________________________
FOREX MARKETS MONITOR
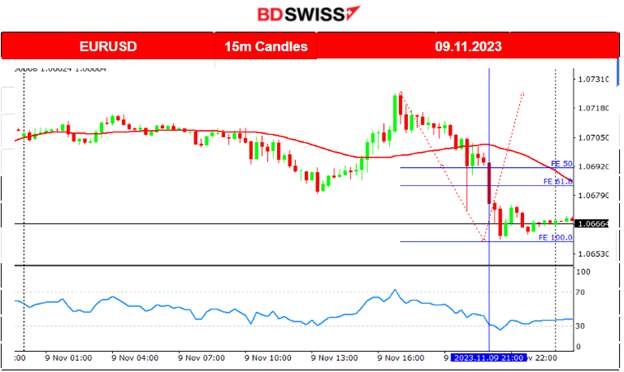
EURUSD (09.11.2023) Chart Summary
Server Time / Timezone EEST (UTC+02:00)
Price Movement
The pair started to deviate from the mean by going downwards. It changed direction to the upside and so moved around the mean. However, it eventually settled lower as the USD was picking up strength against the EUR. The last movement to the downside was a relatively rapid one. The pair found strong support at near 1.06580, that could serve as the 100 Fibo level. A retracement is possible back to 1.06790.
 ___________________________________________________________________
CRYPTO MARKETS MONITOR
BTCUSD (Bitcoin) 4-Day Chart Summary
Server Time / Timezone EEST (UTC+02:00)
Price Movement
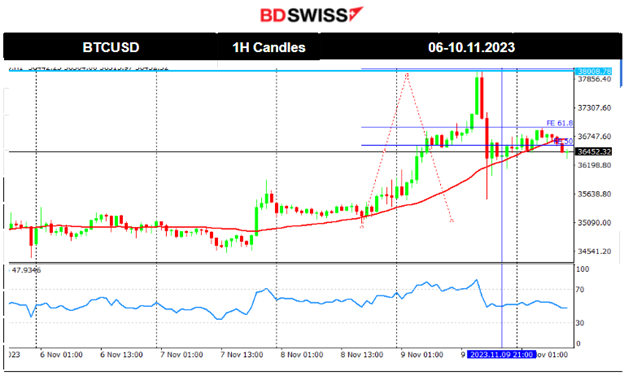
Bitcoin started to gain ground and began a path to the upside that seemed to have an exponential pace. The price broke the 36000 resistance and jumped to the next level at near 36800. Then it surprisingly jumped to the strong resistance near 38000 before eventually reversing back fully to the mean and settling near 36500.
Bitcoin’s recent upswing is mainly due to “optimism around a near-term spot Bitcoin ETF approval and a resulting short-squeeze,” Brian Rudick, a senior strategist at crypto trading firm GSR, told Fortune. Bitcoin “continues to perform well as the market focuses on the U.S. spot ETF approval process,” sources say.
https://finance.yahoo.com/news/bitcoin-approaches-38-000-ethereum-165519468.html
Crypto sorted by Highest Market Cap:
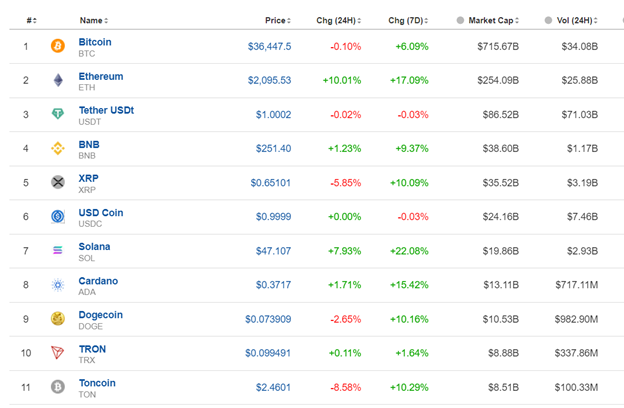
The crypto market continues with gains. Crypto movements far outpaced the stock indices, with the NASDAQ and S&P 500 basically flat over the past 24 hours.
Source: https://www.investing.com/crypto/currencies
______________________________________________________________________
EQUITY MARKETS MONITOR
NAS100 (NDX) 4Hour Timeframe Chart Summary
Server Time / Timezone EEST (UTC+02:00)
Price Movement
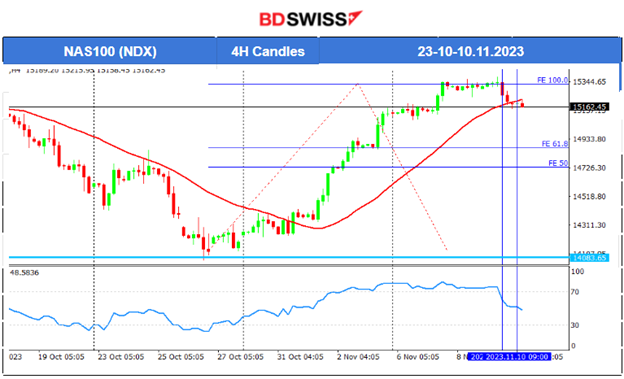
All benchmark U.S. indices have been experiencing the same path upwards lately. The RSI still shows lower highs, it is a matter of time before the market eventually retraces back. We will wait until we have more evidence that there is an end to this uptrend and support breakouts indicating a reversal and a long retracement for the price correction to the downside. The price currently crossed the 30-period MA (H4) on its way down and approaches the support at 15100. Breakout to the downside could trigger that retracement.
 ______________________________________________________________________
COMMODITIES MARKETS MONITOR
USOIL (WTI) 4-Day Chart Summary
Server Time / Timezone EEST (UTC+02:00)
Price Movement
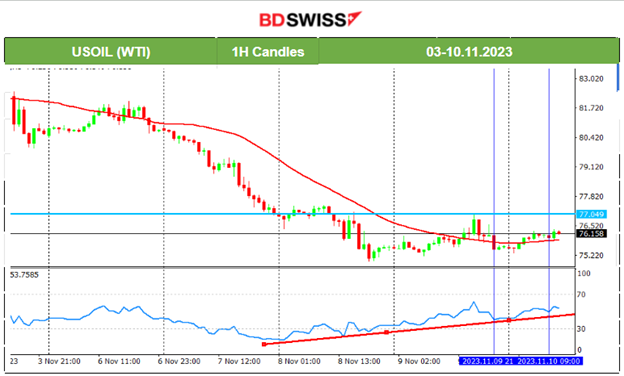
Crude movement was to the downside lately, following a short-term downward trend. It found strong support at 75 USD/b, after which the price eventually reversed to the upside, showing signs that the trend is over, also confirming the bullish divergence signal. Breakout of the 77 USD.b will be a strong signal for a retracement potentially reaching 78 USD/b the least.
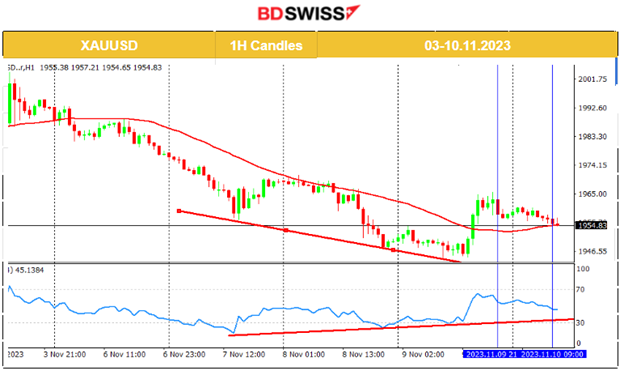
XAUUSD (Gold) 4-Day Chart Summary
Server Time / Timezone EEST (UTC+02:00)
Price Movement
Gold jumped during the NFP report and immediately reversed to the downside with mean reversal. During the jump it reached the resistance at near 2004 UD/oz, however, it reversed lower and remained on the downside. Since then, we have had a clear downward trend.
The RSI showed signals of a bullish divergence (higher lows) while the price was showing lower lows. On the 9th Nov, the price reversed. It jumped higher crossing the 30-period MA, confirming the bull signal and retraced back to the mean after finding strong resistance.
 ______________________________________________________________
News Reports Monitor – Today Trading Day (10 Nov 2023)
Server Time / Timezone EEST (UTC+02:00)
- Midnight – Night Session (Asian)
No major announcements, no special scheduled releases.
- Morning–Day Session (European and N. American Session)
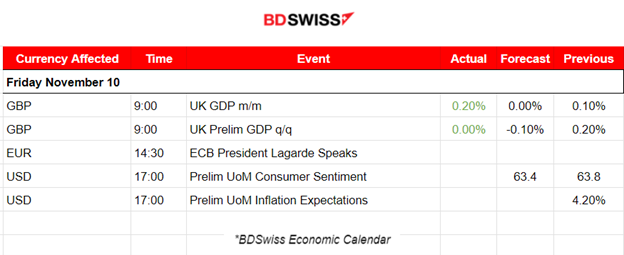
The monthly real gross domestic product (GDP) is estimated to have grown by 0.2% in September 2023, following a growth of 0.1% in August 2023, revised down from the growth of the previous report at 0.2%. GDP, in general, showed no growth in the three months leading up to September 2023. No major impact on GBP pairs was recorded.
At 17:00, the USD pairs might see a moderate intraday shock upon releasing the Prelim UoM Consumer Sentiment and Inflation Expectations report for the U.S. Important reports, especially the inflation expectations figures, since expectations manifest to real figures.
General Verdict:
______________________________________________________________


