

Previous Trading Day’s Events (02.07.2024)
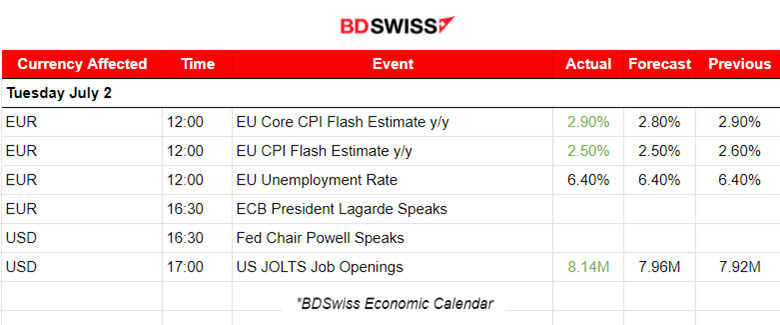
In June, consumer inflation in the 20 nations sharing the euro currency slowed to 2.5% from 2.6% a month earlier. This is in line with expectations in a Reuters poll of economists, as a rise in energy and unprocessed food costs moderated.
This closely watched core inflation figure held steady at 2.9%, coming above expectations for 2.8%, mostly on a continued 4.1% rise in services prices.
The figures are unlikely to provide the ECB much clarity on where prices are heading and ECB President Christine Lagarde already said that more time is needed to be certain, so there should be no hurry to ease policy further.
______________________________________________________________________
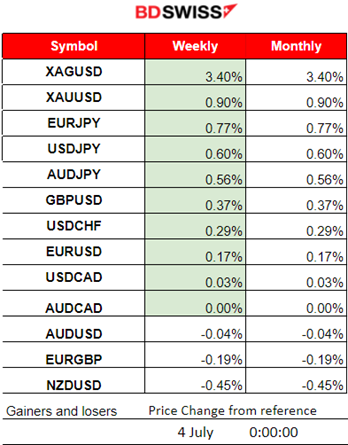
Winners vs Losers
Metals reached the top this week with gains of 3.40% for Silver and 0.90% for Gold. JPY pairs follow (JPY as quote currency) since the JPY is weakening further and further.
 ______________________________________________________________________
News Reports Monitor – Previous Trading Day (02.07.2024)
Server Time / Timezone EEST (UTC+03:00)
- Midnight – Night Session (Asian)
No important news announcements, no important scheduled releases.
- Morning – Day Session (European and N. American Session)
Inflation from major regions so far shows that inflation could be more aggressive than expected or kept stable as price pressures seem to be high enough. ECB now sees a higher-than-expected Core figure in the CPI inflation report released at 12:00. No major impact was recorded in the market at that time.
The JOLTS report showed that job openings unexpectedly grew in May, reflecting a resilient labour market. That could explain the recent USD appreciation that was observed recently. At the time of the news, however, there was no special impact on the market.
General Verdict:
 __________________________________________________________________
FOREX MARKETS MONITOR
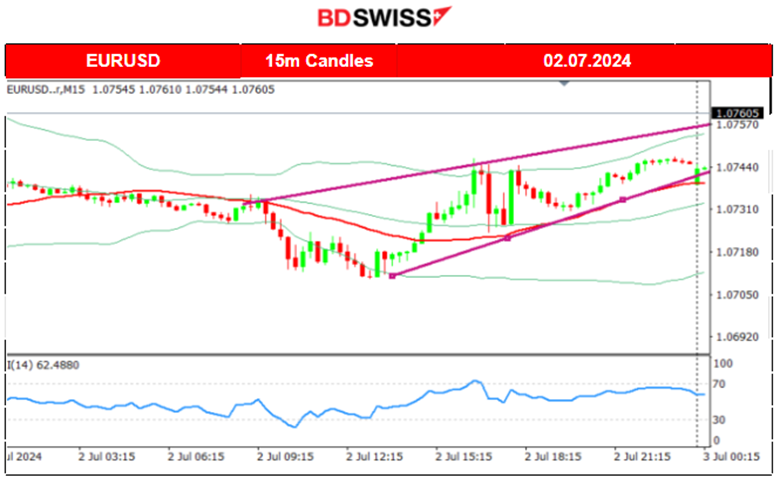
EURUSD (02.07.2024) 15m Chart Summary
Server Time / Timezone EEST (UTC+03:00)
Price Movement
The EURUSD started to move downwards with the start of the European session, but later mid-day it moved to the upside, crossing the 30-period MA on its way up. Retracement followed back to the MA after the pair reached the resistance at 1.07460. The pair moved higher until the end of the trading day.
 ___________________________________________________________________
CRYPTO MARKETS MONITOR
BTCUSD (Bitcoin) Chart Summary 1H
Server Time / Timezone EEST (UTC+03:00)
Price Movement
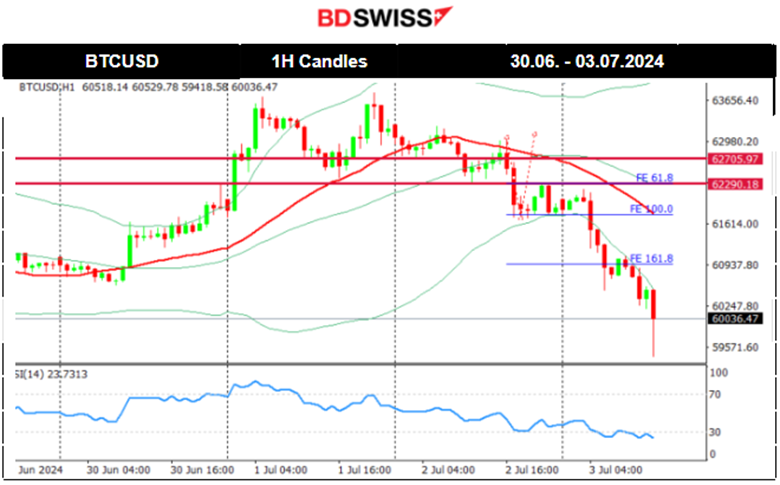
On the 30th of June, the price moved rapidly upwards breaking the 62K resistance and reaching until the next resistance near the 63,600 USD level before starting to retrace. A big recovery for Bitcoin compared with the latest moves. After finding resistance at nearly 63,800 USD, Bitcoin eventually retraced to near the 62,500 USD level as mentioned in our previous analysis. On the 2nd of July, a clear and steady downtrend took place that resulted in Bitcoin breaking more and more support levels, eventually reaching the 60,500 USD support level. On the 3rd of July, the price dropped further reaching 60K USD.
 Crypto sorted by Highest Market Cap:
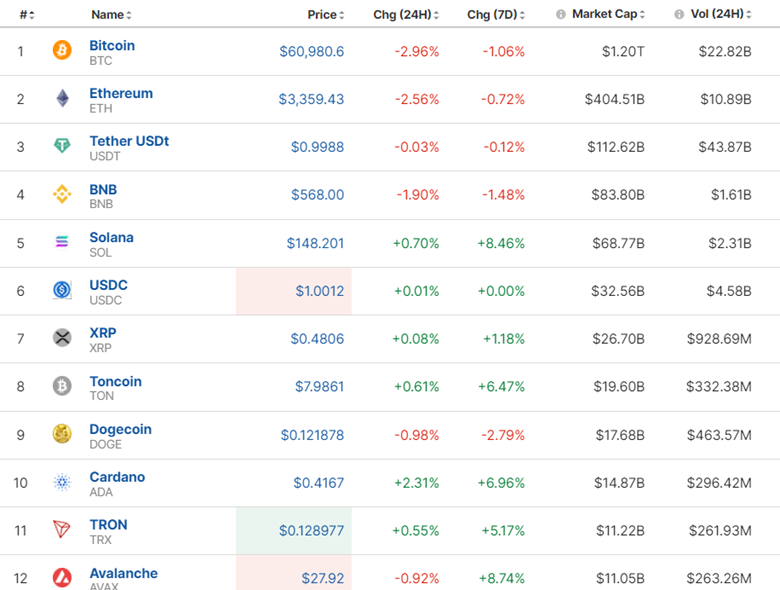
The Crypto Market got a boost after recovering from a recent drop, however the 2nd of July was deterministic for Crypto. Most Crypto suffered losses. Recently a scam, or pyramid scheme, one of the many that exist stopped operations using Crypto for transactions and Crypto wallets. Obviously, as people connect scams with Crypto, it is expected that there will be some downside.
https://www.sec.gov.ph/advisories-2024/metamax-asian-inc-metamax/
https://www.investing.com/crypto/currencies
______________________________________________________________________
EQUITY MARKETS MONITOR
S&P500 (SPX500) 4-Day Chart Summary
Server Time / Timezone EEST (UTC+03:00)
Price Movement
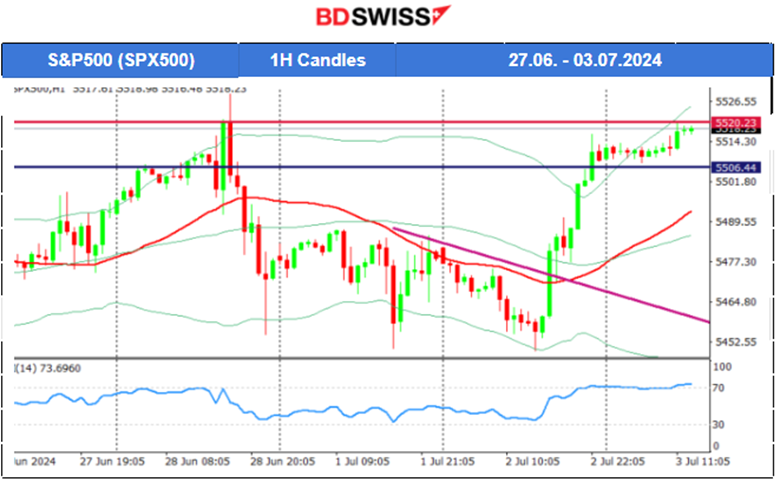
On the 28th, a breakout of the 5,500 resistance led finally to an upward movement continuation of the index. The index found a strong resistance near 5,530 USD before it started to drop significantly, reversing from the upside, crossing the 30-period MA on the way down and reaching the support area near 5,500 USD again without a successful breakout. It remained below the MA with several unsuccessful tests of that support. The index eventually moved to the upside as it was unsuccessful and broke the triangle formation. It crossed the MA on its way up with an overall 60 USD jump. No retracement has taken place yet. 5,500 USD acts as critical support while the 5,520 USD acts as resistance. Waiting for a breakout now.
 ______________________________________________________________________
COMMODITIES MARKETS MONITOR
USOIL (WTI) 4-Day Chart Summary
Server Time / Timezone EEST (UTC+03:00)
Price Movement
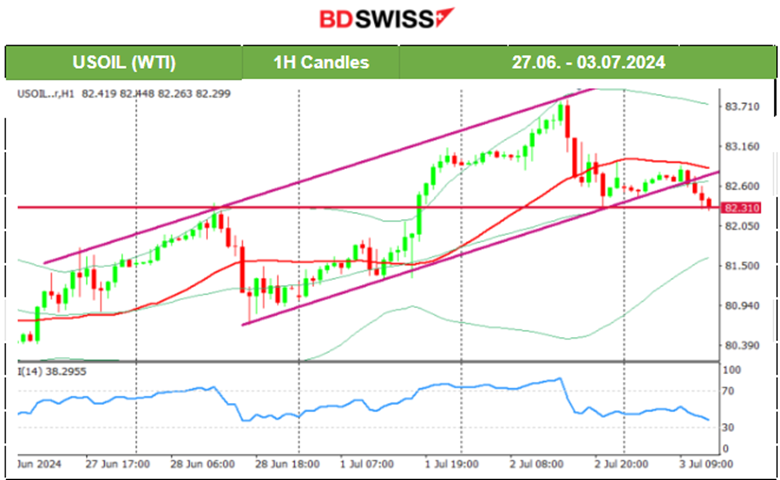
On the 27th, the resistance at 81.7 USD/b broke and Crude oil got a boost, passing 82 USD/b. It was a quite rapid movement to the upside after that breakout. The price eventually found resistance at nearly 82.40 USD/b before the price plunged on the 28th by nearly 1.5 USD/b around 13:00 server time. That was a big dive to 80.70 USD/b and retracement followed soon after reaching the 61.8 Fibo level and back to the 30-period MA. Since the 1st of July a new trend started with the price reaching 83 USD/b. On the 2nd however, the price retraced to the 30-period MA and now tests the 82.3 USD/b support. A breakout to the downside could cause a sharp drop.
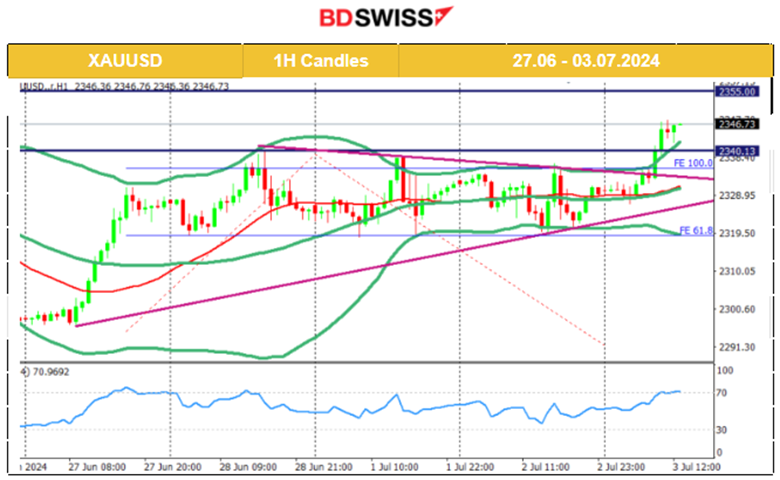
 XAUUSD (Gold) 4-Day Chart Summary
Server Time / Timezone EEST (UTC+03:00)
Price Movement
A triangle breach on the 27th caused it to jump. As mentioned in our previous analysis the price of 2,330 USD/oz was reached and acted as a resistance. The price retraced, reaching the 61.8 Fibo level. On the 28th the price experienced volatility but closed near flat. After a long sideways path, a consolidation that lasted for almost 3 days, gold jumped to the upside on the 3rd of July with a target level of 2355 USD/oz.
 ______________________________________________________________
News Reports Monitor – Today Trading Day (03.07.2024)
Server Time / Timezone EEST (UTC+03:00)

- Midnight – Night Session (Asian)
No important news announcements, no important scheduled releases.
- Morning – Day Session (European and N. American Session)
Services PMI releases are taking place today and the market is already quite active. EUR, and GBP gain ground. USD weakens ahead of the ISM Services PMI that is going to be reported at 17:00.
ADP report for Employment change in the U.S. takes place at 15:30 and is not expected to have a great impact on the market.
The ISM Services PMI is expected to be reported lower as the business conditions view of the sector is that they are not improving. Although the figure remains in the expansion area, its release could potentially weaken the USD further.
General Verdict:
______________________________________________________________


