

Previous Trading Day’s Events (03.04.2024)
Underlying inflation meanwhile fell to 2.9% from 3.1%, coming below expectations for 3.0%, data from Eurostat.
Inflation has been on a steady downward path for more than a year but has fallen more quickly since last autumn than many had predicted, shifting the debate to just how soon and how fast the ECB will unwind record rate hikes.
Meeting next week, the central bank is expected to acknowledge the improved outlook but policymakers are unlikely to cut rates straight away.
The PMI remains consistent with an economy that continues to expand, though at a moderate pace.
Services are the main driver of inflation, via higher wages. With demand slowing, so did services inflation. Data last week showed services inflation excluding energy and housing cooling considerably in February after accelerating in January.
Source:
______________________________________________________________________
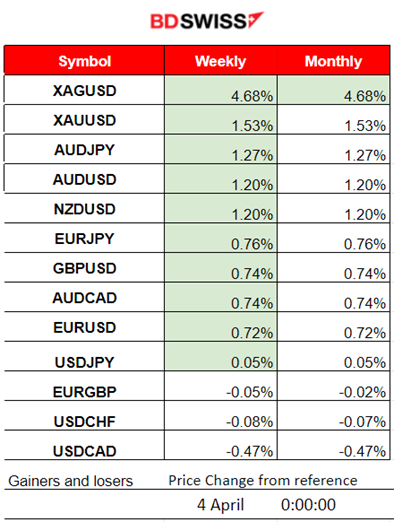
Winners vs Losers
Metals are on the top of the winner’s list for the week. Silver leads with 4.68% gains so far, followed by Gold having 1.53% gains.
 ______________________________________________________________________
News Reports Monitor – Previous Trading Day (03.04.2024)
Server Time / Timezone EEST (UTC+03:00)
- Midnight – Night Session (Asian)
No important announcements, no special scheduled figures to be released.
- Morning – Day Session (European and N. American Session)
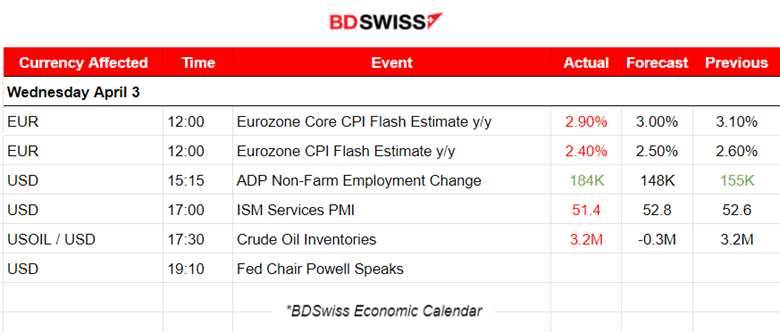
According to the CPI figures at 12:00, Eurozone inflation falls and defies projections, increasing the probability of the ECB proceeding sooner with interest rate cuts. Eurostat reported that headline inflation dropped from 2.6% in February to 2.4% in March: the lowest recorded rate since July 2021, except for the November 2023 figure, which also came in at 2.4%. No major impact was recorded in the market.
Reports at 15:15 showed that private sector employment increased by 184K jobs in March beating expectations and annual pay was up 5.1%year-over-year. Strong figures could indicate delays in cuts. NFP ahead this Friday.
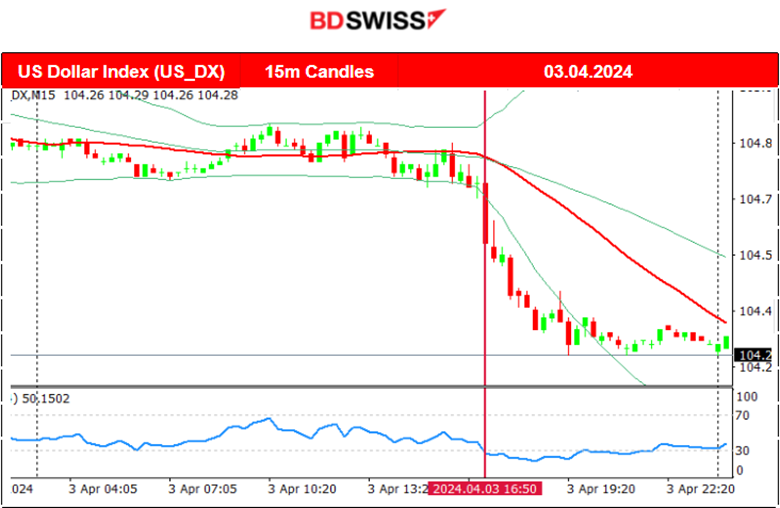
At 17:00 the ISM Services PMI report was released. The U.S. dollar weakened heavily after the release. The Dollar index plunged after 17:00. Gold obviously moved higher. Key factor: the worsening ISM services PMI. Fed’s Powell emphasised the need for more evidence that inflation is easing before cutting rates, however, we already knew this. Prob for a June cut remains close to 60%
General Verdict:
 __________________________________________________________________
FOREX MARKETS MONITOR
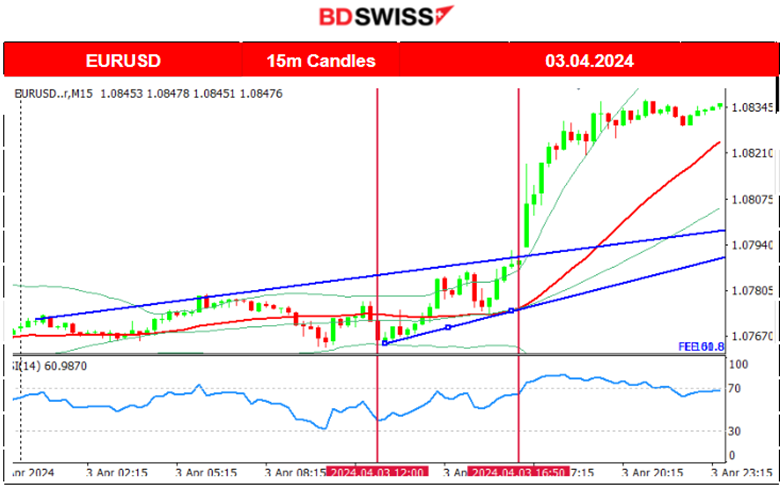
EURUSD (03.04.2024) 15m Chart Summary
Server Time / Timezone EEST (UTC+03:00)
Price Movement
The pair was moving with low volatility even after the start of the European session. More activity and volume started to take place after the U.S. news. The dollar weakening caused the pair to jump. No retracement took place.
 ___________________________________________________________________
CRYPTO MARKETS MONITOR
BTCUSD (Bitcoin) Chart Summary 1H
Server Time / Timezone EEST (UTC+02:00)
Price Movement
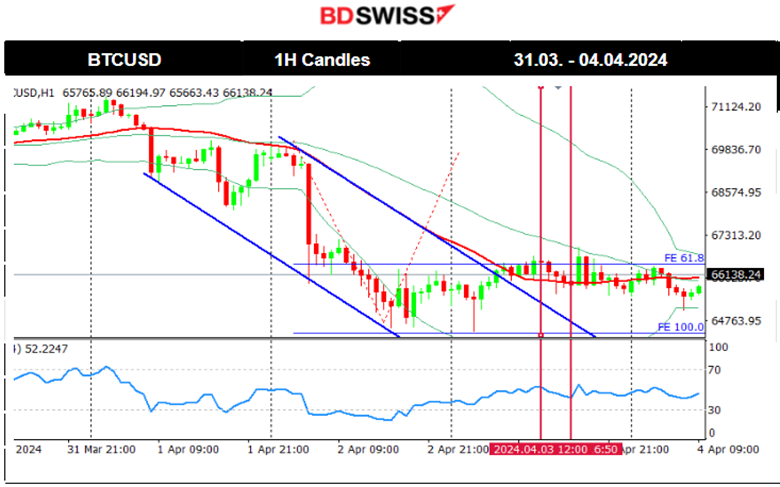
Since the 22nd of March, Bitcoin experienced a good comeback with the price moving upwards crossing the 30-period MA on its way up and showing upward momentum since the fall from the 74K USD peak. The 68K USD level resistance was breached on the 25th of March and the price moved higher even beyond 70K USD. The 30-period MA turned sideways as the price slowed down.
Last week a steady upward movement took place forming a wedge until the 31st of March. On the 1st of April, the price broke the wedge to the downside and dropped heavily back to support near 69K USD. That support was broken twice as Bitcoin eventually on the 2nd of April saw heavy drops. Around the same time as the drawdown, Bitcoin exchange-traded funds (ETFs) posted a net outflow of $86 million, breaking a four-day positive inflow streak, per FarSide data.
Source: https://cointelegraph.com/news/bitcoin-price-flash-crash-leverage-positions-liquidated
On the 3rd of April, we see some retracement, something to expect after a rapid fall in price. It settled at 66,360 USD and remained stable close to that level until now.
 Crypto sorted by Highest Market Cap:
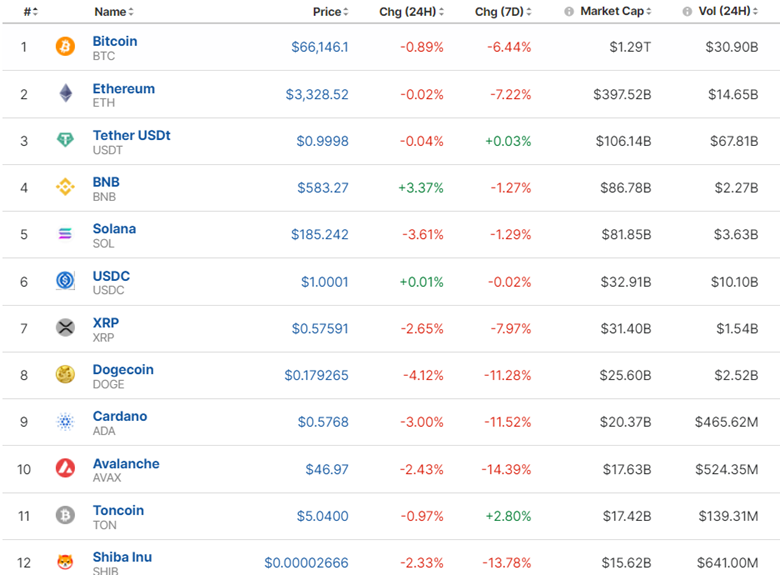
The market for Crypto is currently stable to lower levels. Will ETFs gain strong net inflows once more? Halving is getting closer. Let’s see.
Source: https://www.investing.com/crypto/currencies
______________________________________________________________________
EQUITY MARKETS MONITOR
S&P500 (SPX500) 4-Day Chart Summary
Server Time / Timezone EEST (UTC+03:00)
Price Movement
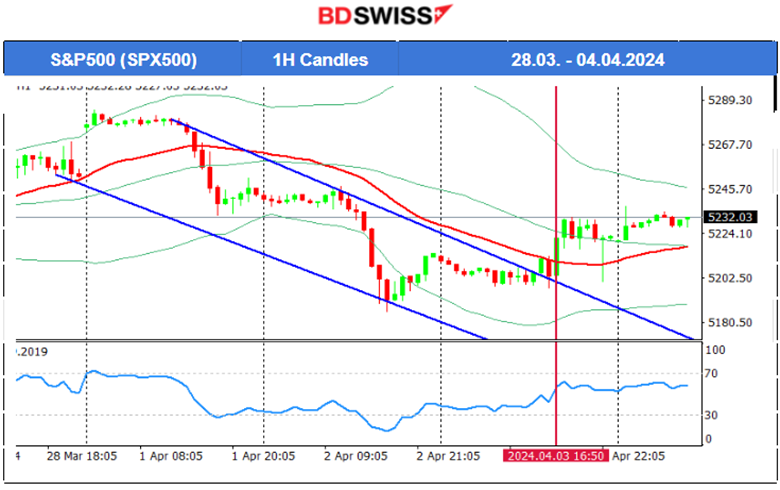
On the 1st of April, the market opened with a gap upwards. Correction followed with a heavy drop until the support near 5,234 USD. Retracement followed with the price approaching and staying close to the 30-period MA. On the 2nd of April, the index suffered another drop, confirming a downtrend, and it was sharp enough. After finding support near 5,186 USD it retraced near the MA. While the dollar weakened, U.S. stocks gained. The downtrend halted and stocks saw the upside. The index moved above the 30-period MA. (SPX500 chart H1). The crossover took place when the dollar plunged yesterday, 3rd April.
 ______________________________________________________________________
COMMODITIES MARKETS MONITOR
USOIL (WTI) 4-Day Chart Summary
Server Time / Timezone EEST (UTC+02:00)
Price Movement
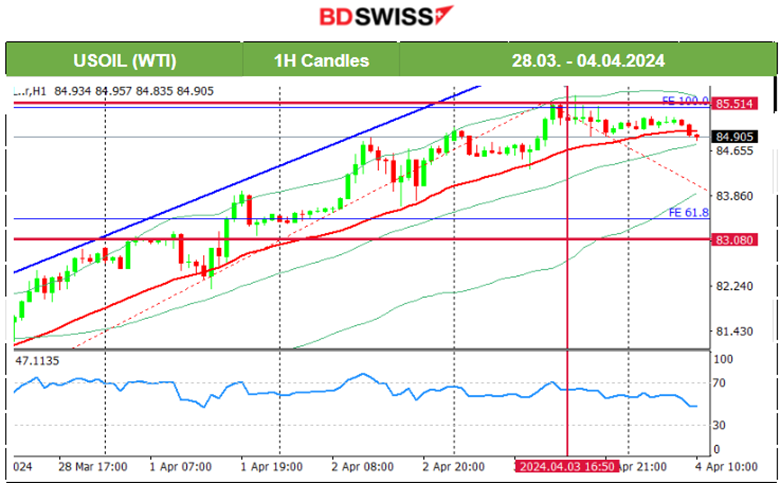
On the 1st of April, after the news regarding the expansion of the U.S. manufacturing sector, Crude oil actually jumped higher and remained on the upside.
The latest news shows that production cuts indeed take place. Reuters Survey Shows OPEC Output Reduced in March:
On the 2nd of April Crude oil continued on the uptrend. The RSI currently shows a bearish divergence with those lower highs. However, a halt of an uptrend requires that the price drops below the 30-period MA. This would further support the halt and a future sideways movement, or even the start of a downtrend (H4 retracement to 83 USD).
OPEC-JMMC meetings: OPEC+ ministers kept oil supply policy unchanged and pressed some countries to increase compliance with output cuts, a decision that spurred international crude prices to their highest in five months at nearly 90 USD/b:
Technicals: Will the price drop and cross the 30-period MA signalling the halt of the uptrend? I am still expecting a retracement if this happens. The RSI’s lower highs support this view. Fundamentals, not so much.
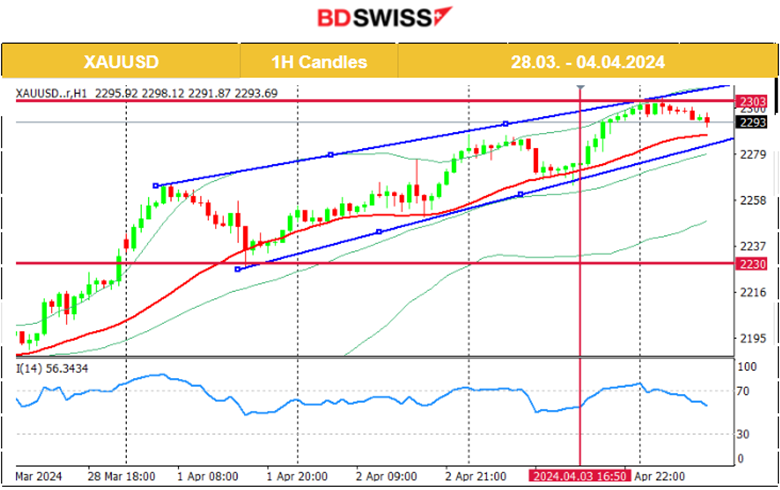
 XAUUSD (Gold) 4-Day Chart Summary
Server Time / Timezone EEST (UTC+03:00)
Price Movement
On the 1st of April the price lowered and despite the manufacturing PMI favourable for the USD release that caused the price to drop heavily, Gold could not remain on the downside. An uptrend was formed and kept stable for some time. On the 2nd of April, its price reached 2,288 USD/oz and on the 3rd of April, it retraced to the MA. There is currently an upward wedge. Gold continues to move along the wedge to the upside without a breakout. The Dollar index plunged after 17:00 yesterday. Gold obviously moved higher. Key factor: the worsening ISM services PMI.
 ______________________________________________________________
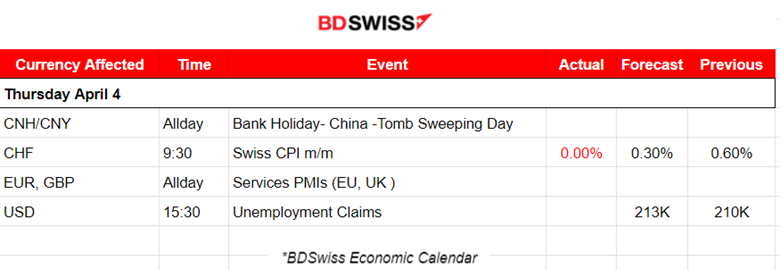
News Reports Monitor – Today Trading Day (04 April 2024)
Server Time / Timezone EEST (UTC+03:00)
- Midnight – Night Session (Asian)
No important announcements, no special scheduled figures to be released.
- Morning – Day Session (European and N. American Session)
The Swiss consumer price index (CPI) remained unchanged in March 2024 compared with the previous month at 107.1 points (December 2020 = 100). Inflation was +1.0% compared with the same month of the previous year. CHF suffered depreciation because of this 0% change. USDCHF jumped 40 pips.
Services PMIs come out today for the eurozone and the U.K. Increased volatility is expected.
General Verdict:
______________________________________________________________


