Rates as of 04:00 GMT
Market Recap
Yesterday morning I said markets had gone up for no discernable reason on Wednesday. They fell for the same reason on Thursday. This morning the mood is still bad, with every stock market in Asia in the red.
A few things to point out –
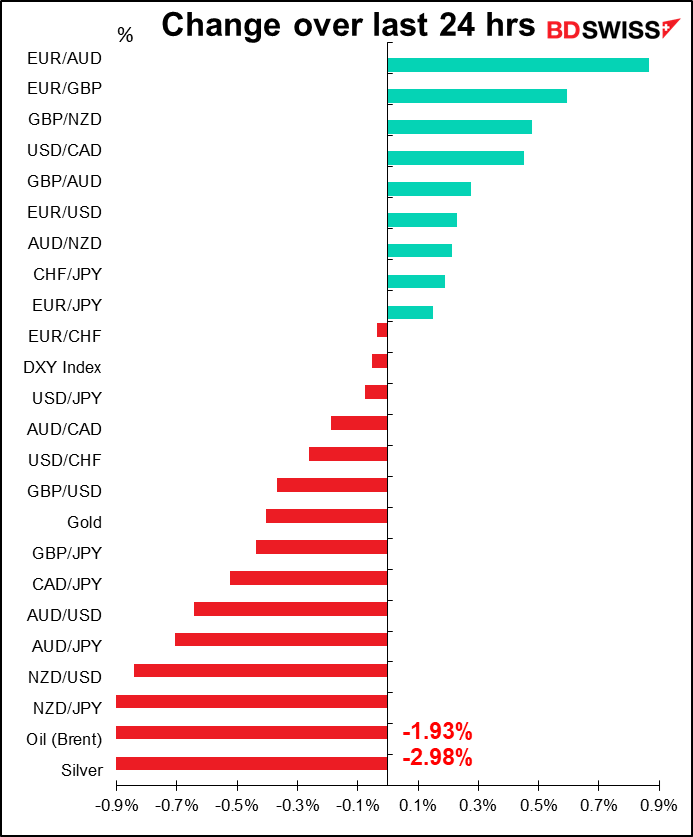
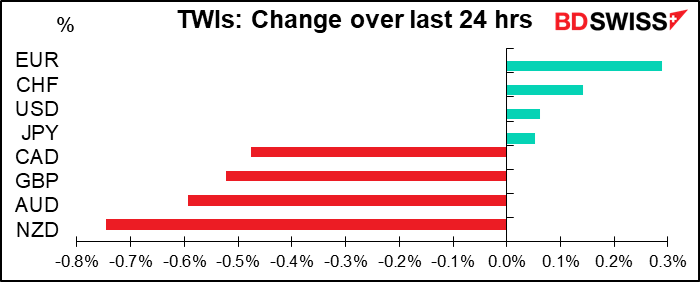
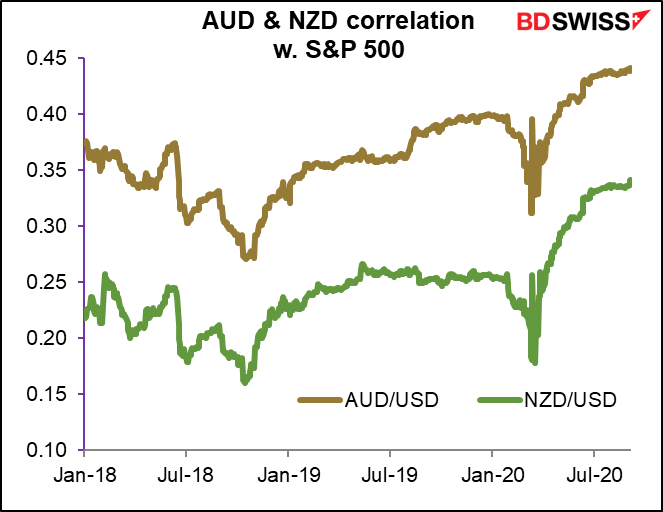
NZD was the biggest loser, not AUD. We’ve seen NZD having a higher beta to the markets than AUD several times recently. (The Greek letter beta β refers to how much asset B changes when asset A changes. For example, if something has a beta of 0.5 to the stock market, when stocks go up 1% it will go up 0.5%.) In any case, the correlation of both of these currencies with stock markets has been going up since the recovery from the pandemic started, meaning that they are moving more and more in line with global growth prospects.
- EUR was the biggest gainer overall, not USD. EUR/USD rose on the day. Is the dollar losing some of its safe-haven appeal or did people just think that the sudden EUR pessimism had gotten out of hand?
- EUR/JPY moved up just a bit (20 pips) while EUR/CHF moved down an even smaller bit (-4 pips). In other words, EUR kept pace with the so-called “safe haven” currencies in this downturn.
Lots of different things are being trotted out as a reason for the plunge. On the one hand, two well-respected officials doubted that the US would have a vaccine by 1 Nov. Hopes generated by the CDC’s call for states to be ready for a vaccine by Nov. 1st — the notification that I said yesterday was simply a political ploy – was said to be one of the reasons for the market going up on Wednesday. But Dr. Moncef Slaoui, one of the two men in charge of the US government’s drive to develop a vaccine, said he thought it was “extremely unlikely but not impossible” to have one available by then. And Dr. Anthony Fauci, the most respected person in the US with regards to the virus, said he thought it was “conceivable…though I don’t think that’s likely.”
The other issue has been the incredible outperformance of the NASDAQ and tech stocks in general in what’s one of the most incredible rallies ever. These stocks have just been soaring.
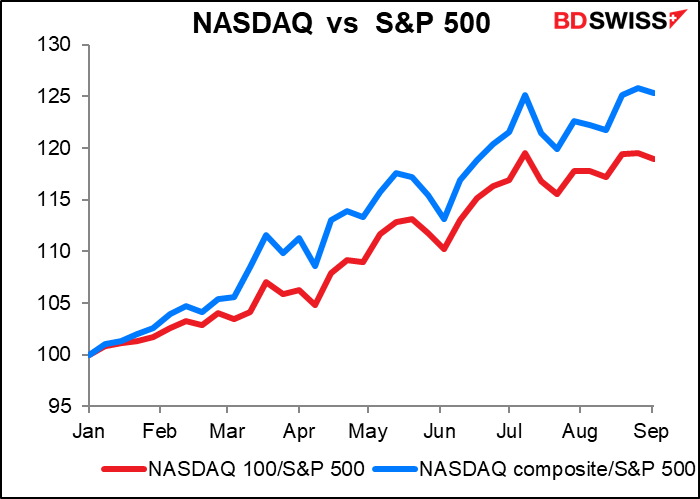
The demand for extremely speculative, deep out-of-the-money calls on tech stocks has been wild. Implied volatilities – a measure of the price people are willing to pay for the option – have at least doubled this year, and more for some of them. (For an explanation of delta in this context, please see here.)
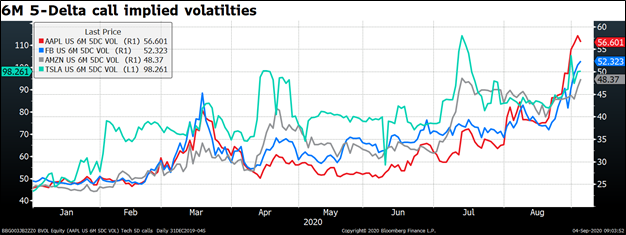
The demand for such speculative options is an indication of the fever surrounding these stocks, but it’s also an explanation for their ascent. Market-makers who sell these options are structurally short the stocks. As the stock prices rise, they have to go into the market and cover their short positions – delta-hedging, it’s called – and that pushes the price up further, fuelling more demand.
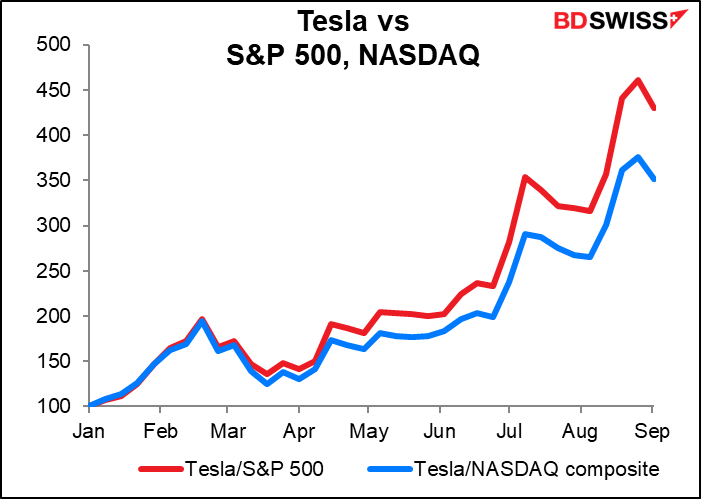
The sudden decline in Tesla – the King of all speculative tech stocks – this week would’ve brought home to some traders the risks and helped precipitate the shake-out in risk. Tesla fell 10% from its peak Monday to its close Wednesday – that very likely would’ve scared some margin buyers on Thursday, who pushed the stock down another 9%. Nonetheless the stock is still up 386% this year so we can hardly say it’s down at all.
Today’s market
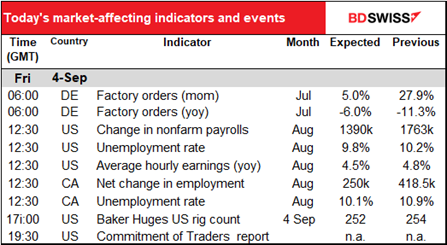
It’s NFP day today! We’ll all be waiting for the US nonfarm payrolls (NFP), and if past performance is any guide to future performance (which I’m required by law to say it’s not), it will all be over in a matter of minutes and we’ll wonder what all the excitement was about.
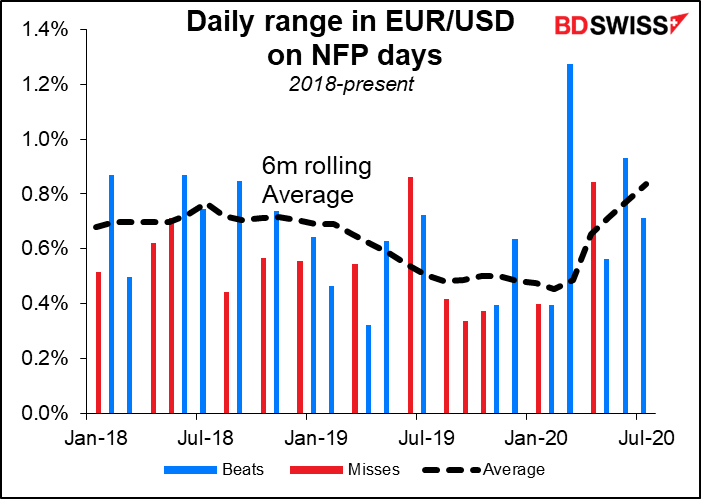
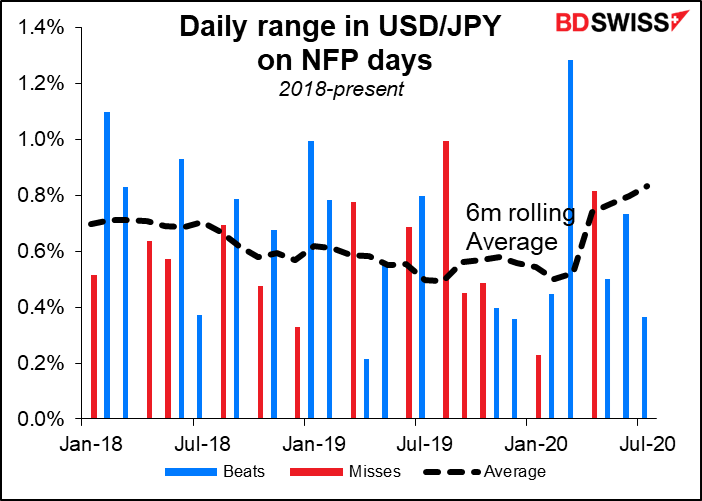
In fact, volatility as measured by the difference between the lowest and the highest rate of the day tends to be lower than average on NFP days. But never mind.
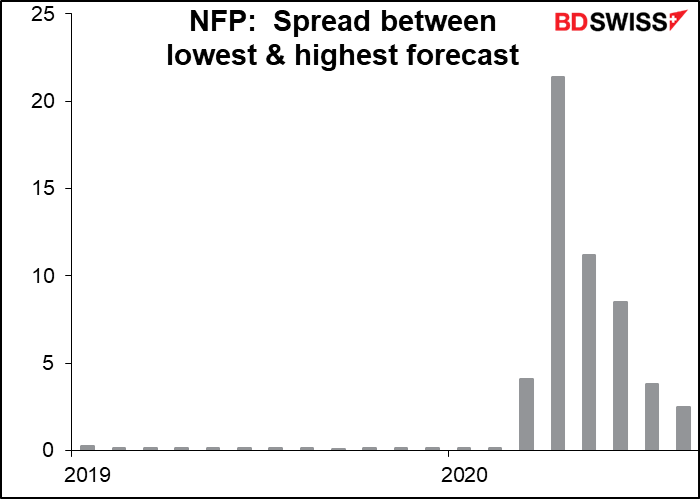
Especially nowadays, the range of “forecasts” is so extraordinary that there’s almost no point in talking about whether the figure missed or beat estimates. This month for example although we say that the “market consensus” forecast is +1390k, in fact this is simply the median of estimates that range from -100k to +2400k, a 2.5mn range. That’s a pretty wide target.
The following graph shows the range of estimates. During 2019 and the first two months of 2020 it averaged 149k. In April it was 21.4mn and in May, 11.2mn.
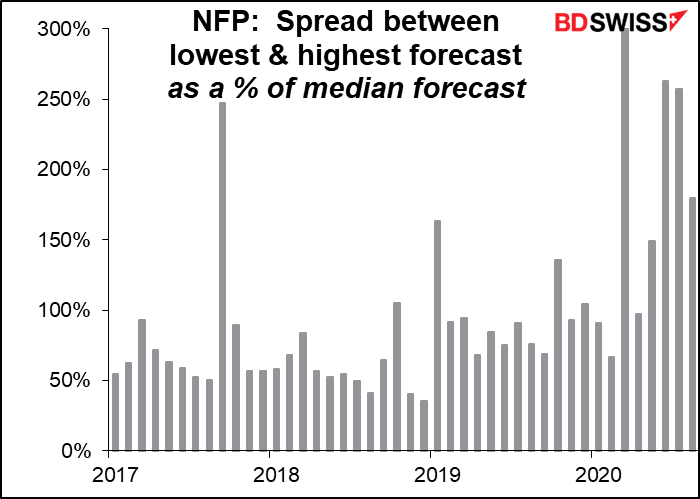
Looked at as a % of the median it’s not as big a change, but it’s certainly a lot wider than it was before.
The reason I focus on this is to point out that usually the market is reacting to how the actual figure compares with what they expect. But when expectations are all over the place – when the “market consensus” doesn’t reflect any consensus at all – is this a valid way of thinking?
Well, we can get all philosophical about this, but we’re here to make money, not to be right. So let’s look at the numbers and ignore the pesky question about whether they mean anything.
The median of estimates – I won’t call it the market consensus – is for 1390k new jobs to be added to payrolls. This is a test of whether the market is a “glass half full” or “glass half empty” type or market – is it good news that the number of jobs is rising again, or is it bad news that the number of new jobs each month is declining? With some 27mn people still getting unemployment benefits, I’m firmly in the “half empty” camp, or even “mostly empty” camp, especially as the special unemployment benefits lapsed at the end of July (after the survey week though so it didn’t affect the data).
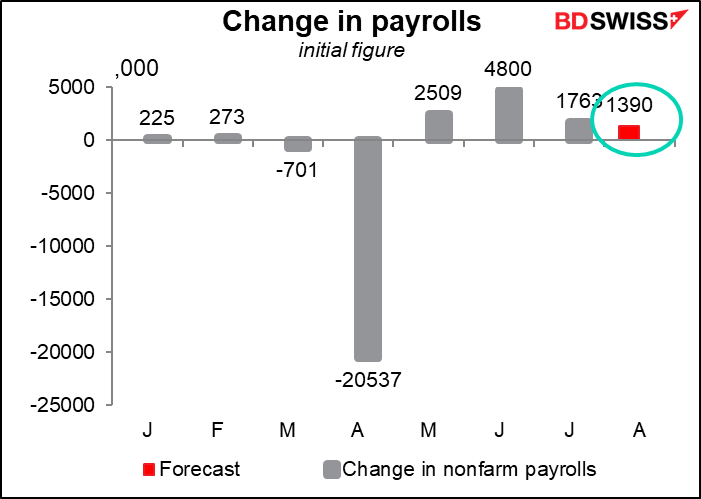
The unemployment rate is expected to fall into single digits for the first time since the pandemic began. That sounds great until you remember that during the Global Financial Crisis, which at the time was the worst economic catastrophe since the Great Depression, the unemployment rate peaked at 10.0%. Peaked. Now we’re happy that it’s getting back down to that level.
This measure of unemployment, called the U-3 unemployment rate, doesn’t really count everyone who’s unemployed. The U-6 rate is a better estimate, and that was 16.5% in July, not far off its peak of 22.8% in April. During the GFC this measure peaked at 17.2% in December 2009.

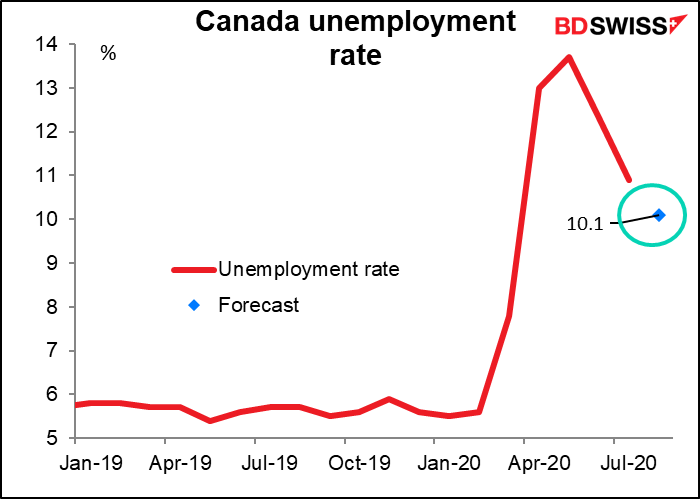
Canada is expected to see something of the same: another rise in the number of jobs, but at a slower pace than before.

Their unemployment rate too remains stubbornly high. In 2009 it peaked at 8.7% so they are doing much worse now than they did back then. No wonder the Bank of Canada has taken such an expansive approach.
