PREVIOUS TRADING DAY EVENTS – 21 March 2023
Announcements:
Summary Daily Moves – Winners vs Losers

News Reports Monitor – Previous Trading Day 21 March 2023

- Midnight > Night Session (Asian)
No important figures/release > The release of the Monetary Policy Meeting Minutes for Australia at 2:30 (GMT+2) could have a slight impact on the AUD pairs. Overall, we did not expect any shocks during the Asian Session due to scheduled announcements.
- Morning – Day session (European)
Important scheduled release at 14:30 (GMT+2), CPI monthly release (Change in the price of goods and services purchased by consumers). An important inflation-related release that could cause a shock to the CAD pairs and break support and resistance levels creating opportunities.
ECB President Lagarde gave her speech simultaneously and could cause trembling markets. Eyes were fixed on EUR pairs looking for trends but no intraday shocks.
General Verdict:
– We were expecting low Market volatility in general, which would change after 14:00.
– We were expecting trending markets only from fundamentals.
– We were expecting a shock after the CPI news, depending on the figures it would have a high or low impact on the CAD. It is fixed at 0.5% and was not expected to change.
______________________________________________________________________
FOREX MARKETS MONITOR
EURUSD 4-Day Chart Summary
Price Movement
The EURUSD continued its path upwards, moving on an upward trend above the 30- period MA since the 16th of March. The Euro looks strong before the Fed’s decision today, 22nd March at 20:00 (GMT+2).

EURUSD 21.03.2023 Chart Summary
Price Movement
The pair was moving slowly during the Asian session and only started to move upwards close to 8:00 (GMT+2) as it was approaching European Markets’ opening. The move was a clear shock since it rapidly moved. It stopped when ECB President Lagarde gave her speech around 14:00 -15:00 and then the price reversed.
Trading Opportunities
Fibonacci Expansion can help in identifying the retracement level of 61.8% as per the chart. When the shock ended it could be used to decide going short and when to set the TP.

______________________________________________________________________
USDJPY 4-Day Chart Summary
Price Movement
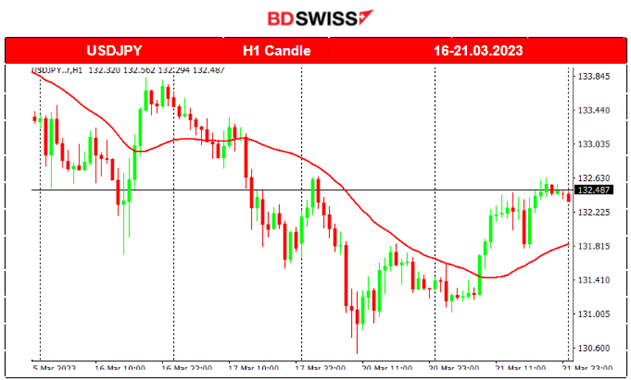
The USDJPY pair has been experiencing a steady downward move the last couple of days, moving below the 30-period MA. As we had previously observed, the JPY has been gaining ground against other major currencies. An apparent reversal happened on the 21st of March when the price moved above the MA with a rapid and massive move.
USDJPY 21.03.2023 Chart Summary
Price Movement
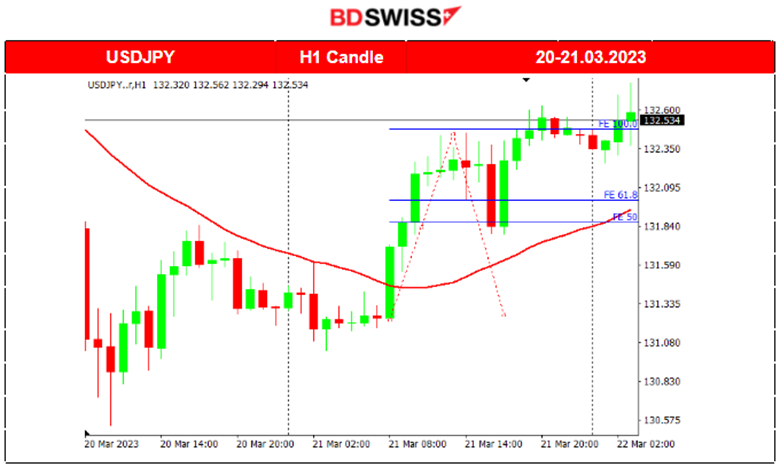
The pair has been moving below the 30-period MA and then a big, upward move leads to the pair moving above the MA. This reversal creates retracement opportunities.
Trading Opportunities
When the price moves above the MA with high speed, it signals that it is a shock that is not going to last for long. It found resistance and the shock ended at some point as depicted by the Fibonacci expansion tool. Hence, the price retraced until even 50% of the move.
______________________________________________________________________
EQUITY MARKETS MONITOR
US30 (Dow Jones Industrial Average) 4-Day Chart Summary
Price Movement
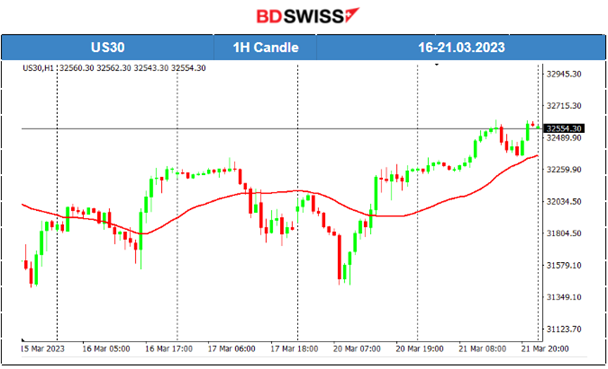
The index was quite volatile the past few days moving around the 30-period MA with big deviations from the MA, close to 400-500 USD deviations. Since the 20th of March, the index has been moving above the MA. This is probably due to the fact that investors are preparing for the Fed’s next interest rate decision which would probably lead to an increase. In addition, during the banking crisis discussions, Treasury Secretary Janet Yellen said deposit insurance could expand. Overall, the impact on stocks is expected to rise at least for the time being.
Trading Opportunities
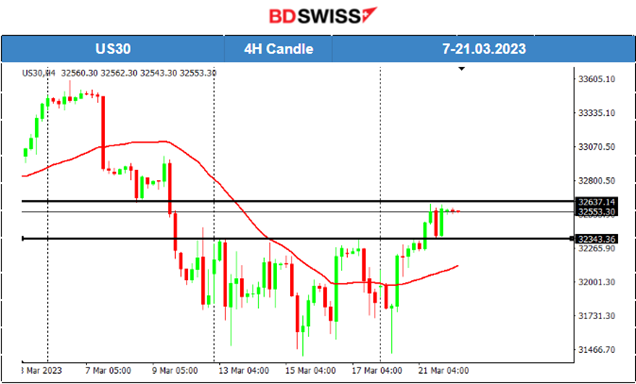
The Stock market has been extremely volatile recently and the indices show upward moves in general. Yesterday, the US30 broke important resistance levels at (32343 USD) going towards new levels at 32640.
Our Forecast here: https://www.tradingview.com/chart/US30/9LyX65vq-US30-Headed-upwards-21-03-2023/
______________________________________________________________________
COMMODITIES MARKETS MONITOR
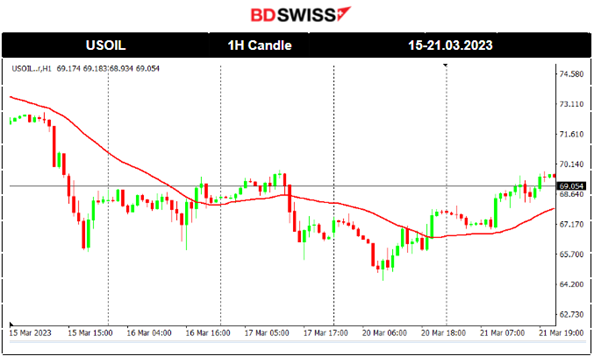
USOIL (WTI) 5-Day Chart Summary
Price Movement
Crude oil prices continued to drop after the release of the latest data regarding production from Russia and the general positive look in the Crude Oil inventories according to Energy Information Administration data.
On the 20th of March, the CFD price of crude oil fell to 64.38 USD after breaking support at 65 USD. Following the US government announcements to protect bank depositors (after the US Banking Crisis) the markets seemed to return back to the “normal” 70 USD level. Crude oil prices were further boosted by Russia saying it will extend its 500,000-barrel-a-day crude output cut through June.
Based on the above, the price crossed over the 30-period MA and continued to move upwards. After the 20th of March, the price moves above it and towards the 70 USD price level.
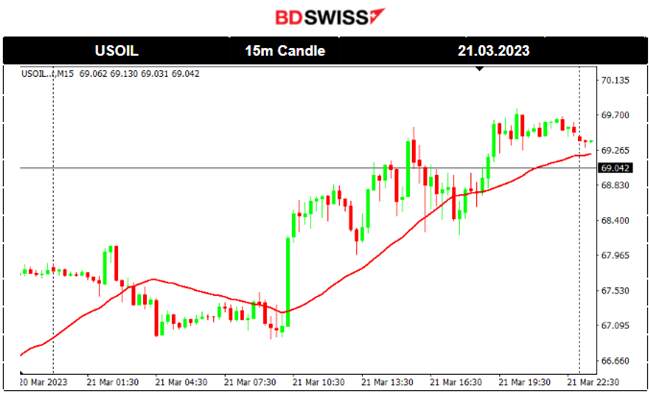
USOIL (WTI) 21.03.2023 Chart Summary
Price Movement
The 21st of March was the day the Crude Oil price started reversing following the recent announcements of the US Government to help depositors. The Federal Reserve’s interest rate decisions and its expected impact on the economic environment are likely to move Oil prices further upwards. The Price is currently moving above the 30-period MA.
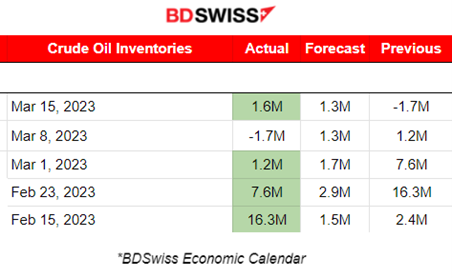
US Crude Oil inventory figures are set to release today. The previous figures are as per below. The market expects a -1.7M change in the number of barrels.
Trading Opportunities
The reversal of any price (not only Crude Oil) creates an opportunity for trading the reversal. In this case, the price fluctuated from moving below the MA to moving above it. Considering the volatility of Crude oil price catching retracements would be appropriate.
______________________________________________________________________
News Reports Monitor – Today Trading Day 22 March 2023

- Midnight > Night Session (Asian)
No important figures/release> No major impact.
- Morning – Day Session (European)
Wednesday is considered a volatile trading day in general. Today we have the CPI figure to be released. This is considered the UK’s most important inflation data and it is expected to be lower than the previous figure; from 10.1% to 9.9%. For the past two years, the highest CPI was reported on Nov 16, 2022, showing 11.1%.
The CPI is announced at 9:00 (GMT+2) early in the morning. Depending on the figure, probably we will see some intraday shock).
Later at 10:45 ECB President Lagarde will give a speech again. Her speeches often cause market volatility as they include interest rates and future monetary policy. EURUSD, GBPUSD and EURJPY will experience some volatile moves but unless some important news comes out, long-term trends are less probable.
Late at 20:00, we have the most important news of the day; the release of the FOMC statement and the release of the Federal Funds Rate figure. On March 16, 2022, the Fed decided to start increasing the rate to 0.50%. Now it is 4.75% and it is expected to be increased to 5% which will definitely cause a shock and traders will look for retracement opportunities. Caution is advised in such cases because late retracements are less likely to happen. Looking for support/resistance breaks should be a must in order to confirm retracements after the shocks.
General Verdict:
– Expecting high Market volatility with no clear long/medium trends.
– Expecting shocks due to the figures to be released.


