Previous Trading Day’s Events (22.04.2024)
______________________________________________________________________
Winners vs Losers
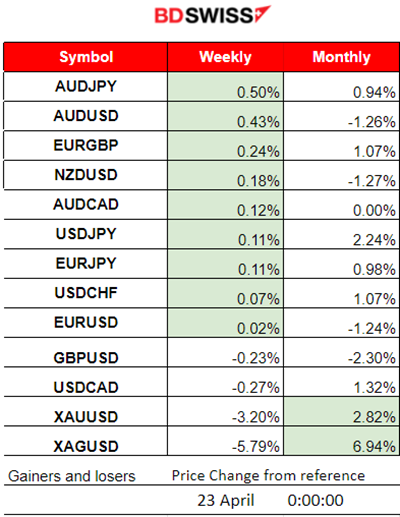
AUDCAD is at the top with 0.50% gains this week. Silver remains the top performer for the month with 6.94% gains so far. Metals fell significantly wiping out significant performance which was accumulated this month. USD remains stable.
 ______________________________________________________________________
News Reports Monitor – Previous Trading Day (22.04.2024)
Server Time / Timezone EEST (UTC+03:00)

- Midnight – Night Session (Asian)
No special news announcements, no major scheduled figure releases.
- Morning – Day Session (European and N. American Session)
No special news announcements, no major scheduled figure releases.
Lagarde:
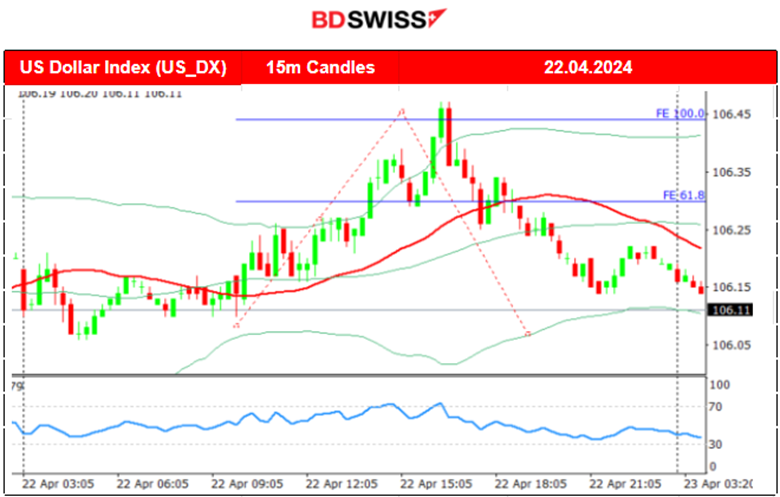
European Central Bank officials plan to cut interest rates multiple times this year, even with higher U.S. inflation delays and tensions in the Middle East keeping oil prices high.
ECB President Christine Lagarde has strongly hinted that the euro zone’s central bank is still likely to begin reducing its deposit rate from a record-high 4% in June.
General Verdict:
 __________________________________________________________________
FOREX MARKETS MONITOR
EURUSD (22.04.2024) 15m Chart Summary
Server Time / Timezone EEST (UTC+03:00)
Price Movement
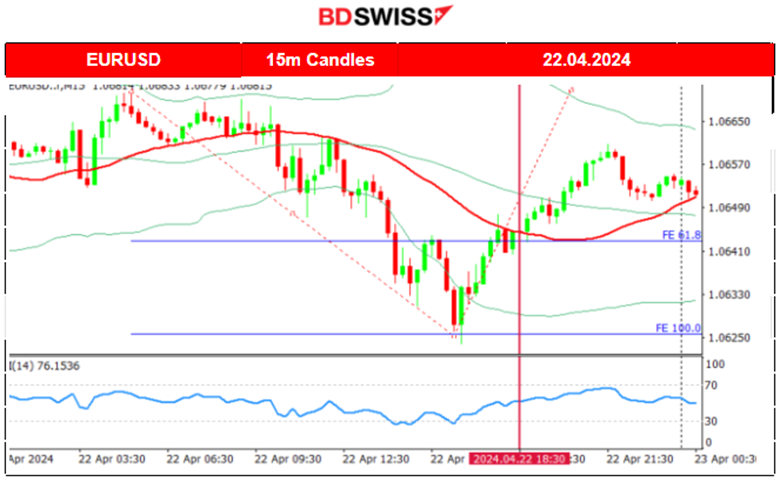
The pair started to drop early after the start of the European session due to U.S. dollar strengthening and found support at near 1.06240. The pair later reversed as the dollar started to depreciate instead heavily. Lagard’s comments at 18:30 did not have much impact on the market. However, the pair continued to move to the upside as the dollar weakened further.
 ___________________________________________________________________
CRYPTO MARKETS MONITOR
BTCUSD (Bitcoin) Chart Summary 1H
Server Time / Timezone EEST (UTC+03:00)
Price Movement
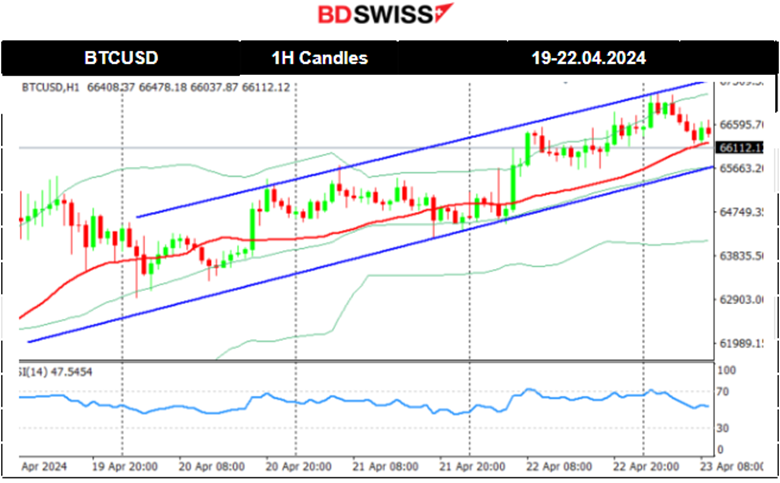
Bitcoin halving took effect late on Friday 19th April, cutting the issuance of new bitcoin in half. It happens roughly every four years, and in addition to helping to stave off inflation, it historically precedes a major run-up in the price of Bitcoin.
Its price started slowly to move to the upside and experienced an uptrend during the weekend. Since the 20th of April, the price moved to the upside post-halving. Bitcoin is on an uptrend with the price moving within a channel.
Source: https://www.reuters.com/markets/currencies/crypto-fans-count-down-bitcoins-halving-2024-04-19/
 Crypto sorted by Highest Market Cap:
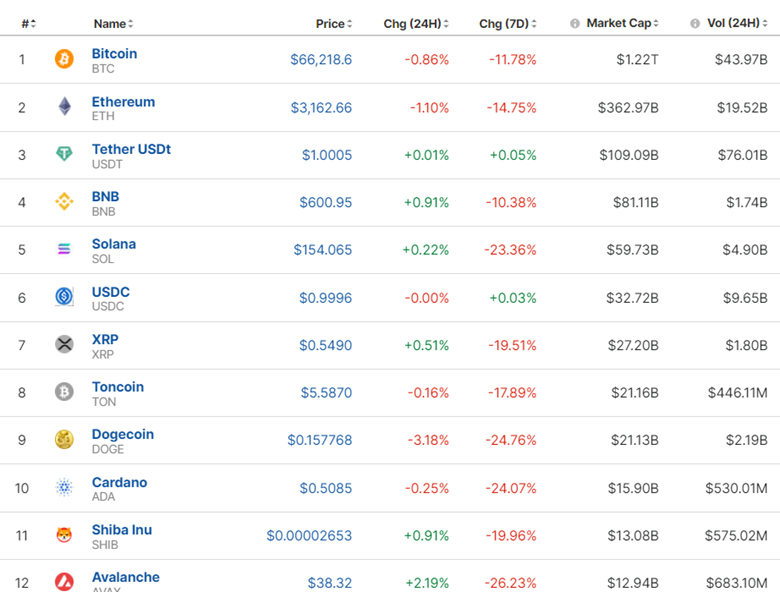
The market seems to have picked up traction as the Bitcoin halving took place. Despite the event, it’s unclear whether it will lead to a price jump as it has in the past.
Source: https://www.investing.com/crypto/currencies
______________________________________________________________________
EQUITY MARKETS MONITOR
S&P500 (SPX500) 4-Day Chart Summary
Server Time / Timezone EEST (UTC+03:00)
Price Movement
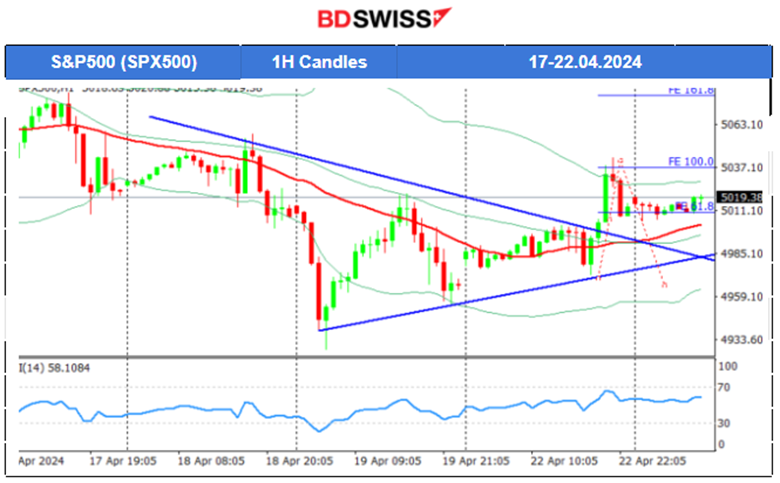
The index was on a downtrend recently as borrowing costs are expected to remain high, plus geopolitical tensions having an impact on expectations and a change to a risk-off mood. Breakout to the upside and of the 5,000 USD level led to a jump of 30 USD on the 22nd of April and a retracement took place soon after. This might be the start of a sideways movement or an uptrend. The resistance of 5,040 USD could be tested again.
 ______________________________________________________________________
COMMODITIES MARKETS MONITOR
USOIL (WTI) 4-Day Chart Summary
Server Time / Timezone EEST (UTC+03:00)
Price Movement
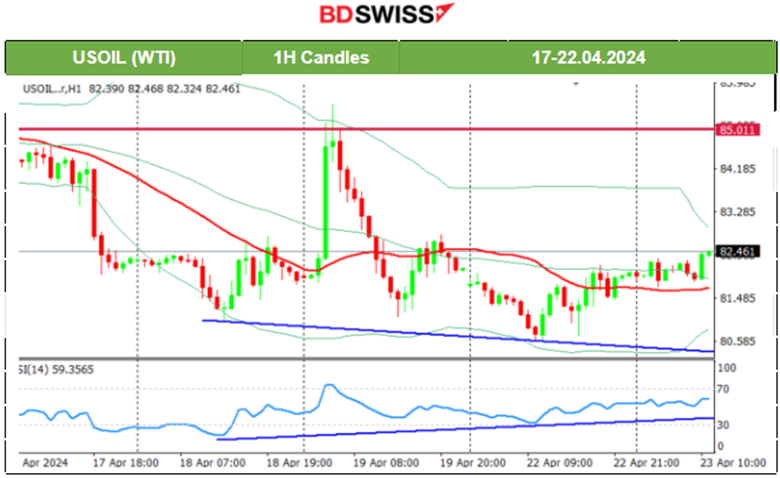
On the 19th of April the news regarding the Israel attack in Iran, caused the commodity prices (Gold and Oil) to jump but only to reverse soon after fully. Currently, lower volatility levels form a triangle formation, and a breakout to the upside (which is possible considering the apparent bullish divergence) could lead the price to reach the 83.5 USD resistance. The 50-period Bollinger Band’s upper band supports the possible next target resistance to be at that level. Crude oil’s volatility could help the price to reach even the 85/b level which acts as a resistance level during this period.
 XAUUSD (Gold) 4-Day Chart Summary
Server Time / Timezone EEST (UTC+03:00)
Price Movement
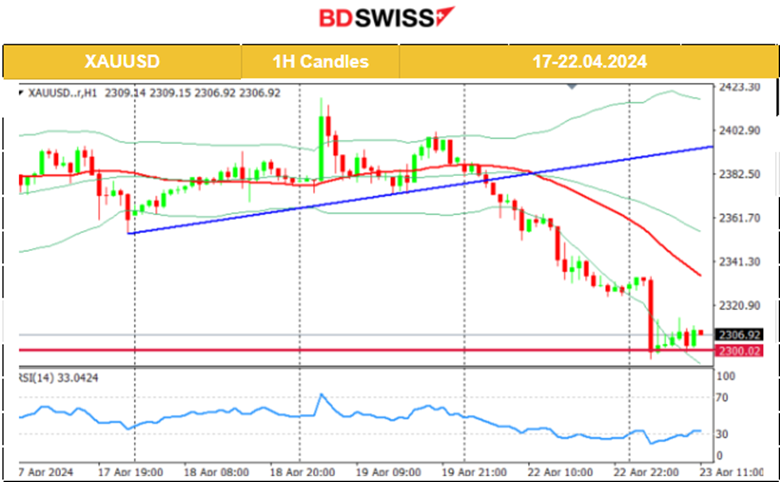
On the 17th of April Gold moved lower as it broke the apparent upward wedge formation reaching the intraday support at 2,355 USD/oz before returning to the 30-period MA. On the 18th of April, Gold stayed in range, flirting with the 2,390 USD/oz at some point but remaining close to the MA. On the 19th of April the news regarding the Israel attack in Iran, caused the commodity prices (Gold and Oil) to jump but only to reverse soon after fully. Gold retreated eventually lower reaching the support at 2,350 USD/oz. On the 22nd the downside path continued aggressively and today it even reached the support at 2,300 USD/oz which could act as a turning point to the upside and a potential retracement to 2,330 USD/oz, close to the MA.
 ______________________________________________________________
News Reports Monitor – Today Trading Day (23 April 2024)
Server Time / Timezone EEST (UTC+03:00)

- Midnight – Night Session (Asian)
No special news announcements, no major scheduled figure releases.
- Morning – Day Session (European and N. American Session)
The Manufacturing and Services PMI figures for the Eurozone, the U.K. and the U.S. will be released causing some impact on the market early affecting the EUR, GBP and USD. Since we have no interest rate policy change, the economic business conditions are expected to remain roughly the same in all these regions.
General Verdict:
______________________________________________________________


