PREVIOUS TRADING DAY EVENTS –26 Oct 2023
Inflation is significantly lower than last year, while the economy has slowed so much that a recession may be underway, making further hikes unlikely.
The ECB President Christine Lagarde kept a further rise in rates on the table as a distant possibility.
“We have to be steady,” Lagarde told a news conference in Athens, where the ECB held its policy meeting for the first time in 15 years. “The fact that we are holding doesn’t mean to say that we will never hike again.” “Sometimes inaction is action. A decision to hold is meaningful,” she said, adding that it was taken unanimously.
Markets now see a high chance the ECB will start cutting interest rates in April and fully price in a move by June, followed by two other cuts before the end of the year.
“The economy is likely to remain weak for the remainder of this year,” said Lagarde. “But as inflation falls further, household real incomes recover and the demand for euro area exports picks up, the economy should strengthen over the coming years.”
______________________________________________________________________
Winners and Losers
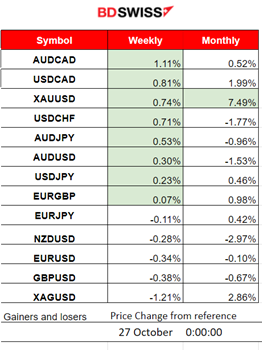
News Reports Monitor – Previous Trading Day (26 Oct 2023)
Server Time / Timezone EEST (UTC+03:00)
- Midnight – Night Session (Asian)
No important news announcements, no special scheduled figure releases.
- Morning–Day Session (European and N. American Session)
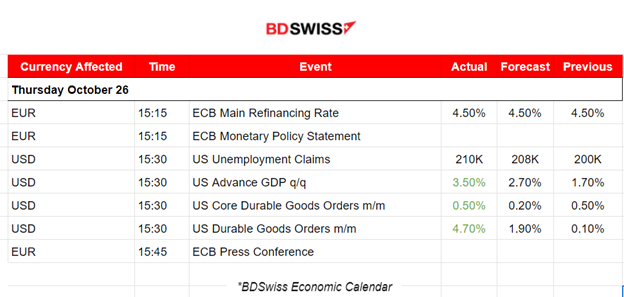
The ECB decided to keep rates unchanged, signalling that there will be no big policy shifts that could create stress for investors while they face risks from war, oil prices and tighter credit conditions. The MRR remains at a record 4%, from below 0% in July 2022, as inflation slows and economic conditions are in deterioration. The EUR experienced a shock and depreciated momentarily but soon the effect was reversed. EURUSD dropped nearly 10 pips before reversing fully back to the mean at the time of the release.
Weekly unemployment claims for the U.S. were reported at 15:30 affecting the USD pairs but with minimal impact. As expected they were reported close to the 200K level, actually at 210K. Recent figures are close to that 200K level since the labour market conditions are thriving for the U.S. considering elevated interest rates and risk. No surprises here and no major shocks.
The U.S. Advance GDP showed a higher figure for the quarter. GDP grew at a 4.9% annual pace in the third quarter, better than expected. Governed by strong consumer spending in spite of higher interest rates, ongoing inflation pressures, and various important domestic and global events. The USD appreciated at the time of the release, experiencing a small shock. The EURUSD dropped nearly 20 pips at that time but the effect was reversed quickly after and so the pair as well.
Durable goods orders were reported 4.7% higher in September, compared with the 1.7% increase expected and the 0.1% decline (revised from +0.2%) in August. Another factor that caused the USD to appreciate at the time of the release, even momentarily.
General Verdict:
 ____________________________________________________________________
FOREX MARKETS MONITOR
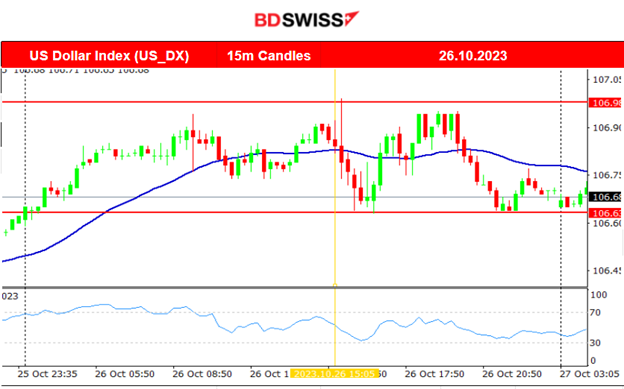
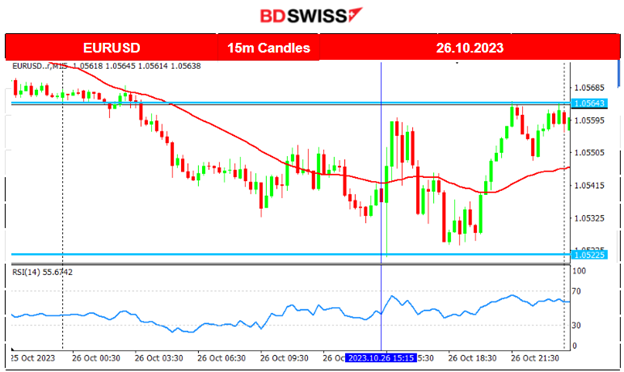
EURUSD (26.10.2023) Chart Summary
Server Time / Timezone EEST (UTC+03:00)
Price Movement
The pair started to move to the downside rapidly as the market anticipated the ECB decision for unchanged interest rates. This is what eventually happened. At the time of the announcement, a low-level shock pushed the pair lower momentarily. It soon reversed to the mean and moved sideways with high volatility closing the trading day almost flat.
 ___________________________________________________________________
CRYPTO MARKETS MONITOR
BTCUSD (Bitcoin) 4-Day Chart Summary
Server Time / Timezone EEST (UTC+03:00)
Price Movement
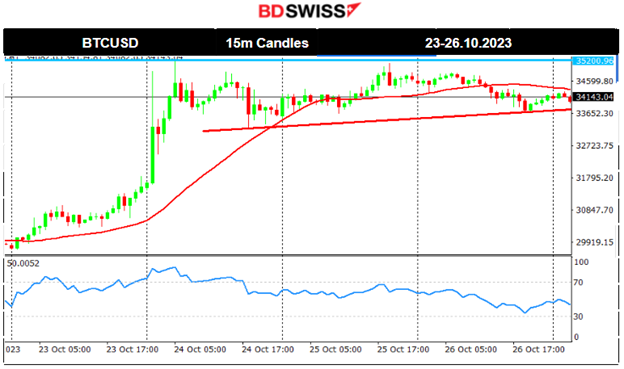
Bitcoin and several cryptocurrencies and related stocks such as Coinbase Global (COIN), Marathon Digital Holdings (MARA), Riot Platforms (RIOT) and Microstrategy (MSTR) experienced a surge in value after a U.S. appeals court ordered the Securities and Exchange Commission to review Grayscale’s application for a spot Bitcoin ETF. Bitcoin has moved significantly to the upside breaking all important resistance levels reaching even until near the level of 35,200 USD, clearly visible on the chart on the 24th Oct. That was the level at which the rapid surge in price finally ended with its price soon retracing back to the 30-period MA. Bitcoin remains in consolidation having 35000 USD as an important resistance level. Fundamentals remain the key factors that push the price to deviate significantly. Currently, its price remains in a consolidation phase. Important resistance remains at the 35200 USD level.
Crypto sorted by Highest Market Cap:
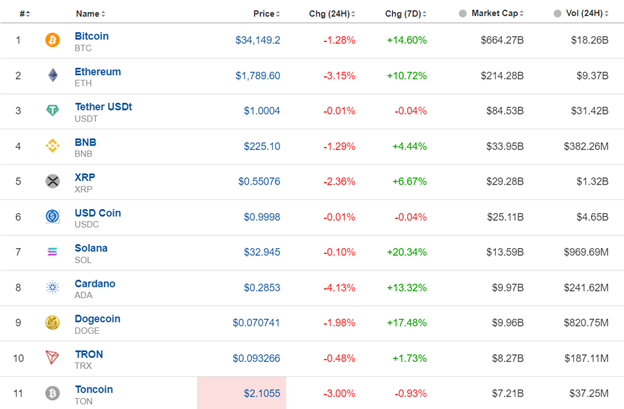
Volatility levels are lower and the markets for Crypto are not moving much. In the last 24 hours, all Crypt suffered losses.
Source: https://www.investing.com/crypto/currencies
______________________________________________________________________
EQUITY MARKETS MONITOR
NAS100 (NDX) 4-Day Chart Summary
Server Time / Timezone EEST (UTC+03:00)
Price Movement
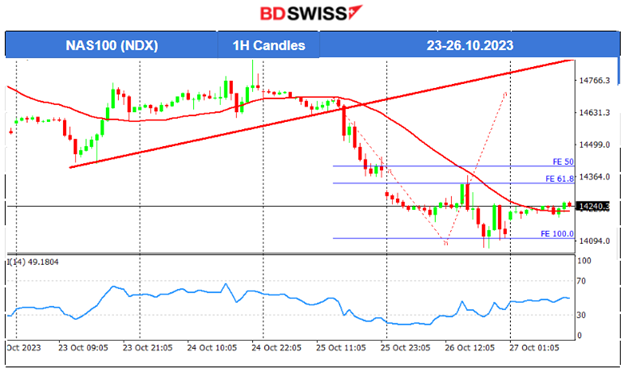
On the 25th the index moved to the downside again as fundamental factors kicked in. The U.S. stock market suffered losses and high volatility. A retracement on the 26th took place after the index found support at near 14180 USD but after that, it moved to the downside again. The index dropped further reaching the next support near 14070 USD before retracing back to the mean and near 14240 USD.
 ______________________________________________________________________
COMMODITIES MARKETS MONITOR
USOIL (WTI) 4-Day Chart Summary
Server Time / Timezone EEST (UTC+03:00)
Price Movement
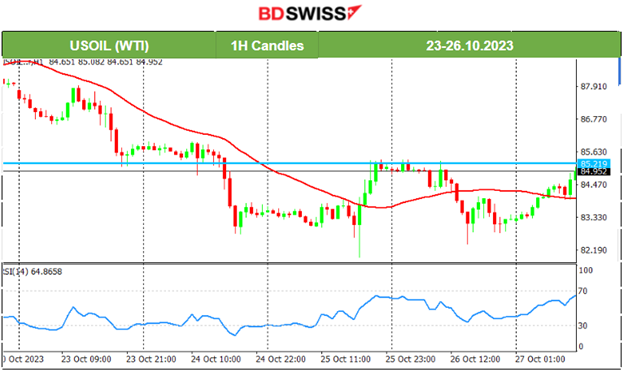
Crude was following a clear downward trend that ended on the 25th Oct. It found support near 82.2 USD /b before it reversed. Yesterday, the price of Crude moved rapidly to the upside reversing and crossing the 30-period MA. It was a retracement from the recent long fall back to the 85 USD/b level. The retracement was in line with the indication of a bullish divergence as per the RSI’s higher lows. Now the price of Crude is on the way to testing the 85 USD/b level. If it breaks, we could see its price go upwards rapidly.
XAUUSD (Gold) 4-Day Chart Summary
Server Time / Timezone EEST (UTC+03:00)
Price Movement
The price of gold was moving mainly sideways with high volatility. We see big deviations from an almost flat 30-period MA. The red resistance line shows that gold broke those resistance levels moving rapidly upwards but the deviation was not great due to the significant resistance level near 1985 USD/oz that keeps the price stable. However, that resistance is broken now and we might see gold moving further to the upside. A long period-triangle formation emerged as well, confirming that a breakout upwards could push the price rapidly to higher levels.
 ______________________________________________________________
News Reports Monitor – Today Trading Day (27 Oct 2023)
Server Time / Timezone EEST (UTC+03:00)
- Midnight – Night Session (Asian)
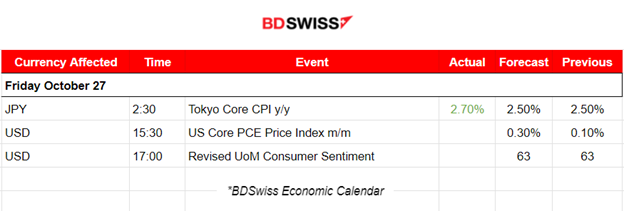
This morning a more heated Inflation is reported for Tokyo. It unexpectedly quickened for the first time in four months in October, indicating that inflation is proving stickier than expected as the Bank of Japan prepares to announce policy next week. At the time of the release at 2:30, no major market impact was recorded.
- Morning–Day Session (European and N. American Session)
At 15:30 the PCE data is to be released for the U.S. The market is expecting a higher figure coinciding with the fact that inflationary pressures are still high in that region. The USD pairs could see a moderate shock at that time.
General Verdict:
______________________________________________________________


