Previous Trading Day’s Events (05.06.2024)
This seemed to be the start of an easing cycle.
“The Governing Council will continue to follow a data-dependent and meeting-by-meeting approach to determining the appropriate level and duration of restriction,” the ECB said in a statement.
Economists see another two rate cuts from the ECB this year, most likely in September and December,
“Interest rate decisions will be based on its assessment of the inflation outlook in light of the incoming economic and financial data, the dynamics of underlying inflation and the strength of monetary policy transmission,” the ECB added. “The Governing Council is not pre-committing to a particular rate path.”
The Fed has clearly signalled a delay in policy easing and a further delay in U.S. rate cuts is likely to make the ECB more cautious too.
Source: https://www.reuters.com/markets/europe/ecb-cuts-rates-keeps-next-move-under-wraps-2024-06-06/
______________________________________________________________________
Winners vs Losers
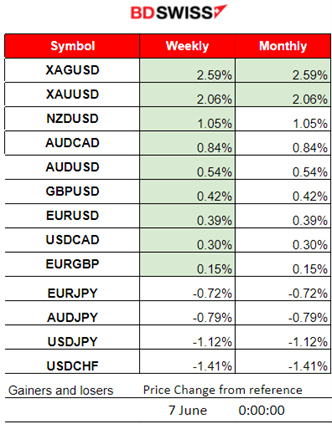
Silver climbed to the top again, this week and gained 2.59% so far. Gold is following with 2.06% so far. JPY pairs remain at the bottom (JPY as Quote). JP
 ______________________________________________________________________
News Reports Monitor – Previous Trading Day (06.06.2024)
Server Time / Timezone EEST (UTC+03:00)
- Midnight – Night Session (Asian)
No important news announcements, no special figure releases.
- Morning – Day Session (European and N. American Session)
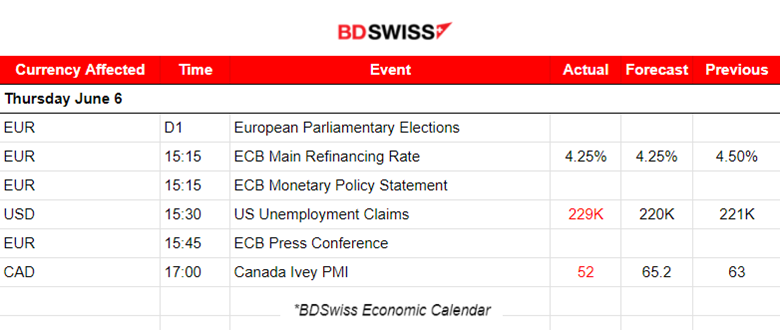
At 15:15 the ECB decided to lower the three key ECB interest rates by 25 basis points.
ECB’s Lagarde: the decision was almost unanimous apart from one governor.
They refrained from giving clear signals about the path ahead. At the same time, the ECB remains attentive to the remaining upside inflation risks and is prepared to keep rates at restrictive levels for as long as necessary.
“Despite the progress over recent quarters, domestic price pressures remain strong as wage growth is elevated, and inflation is likely to stay above target well into next year,” the ECB said.
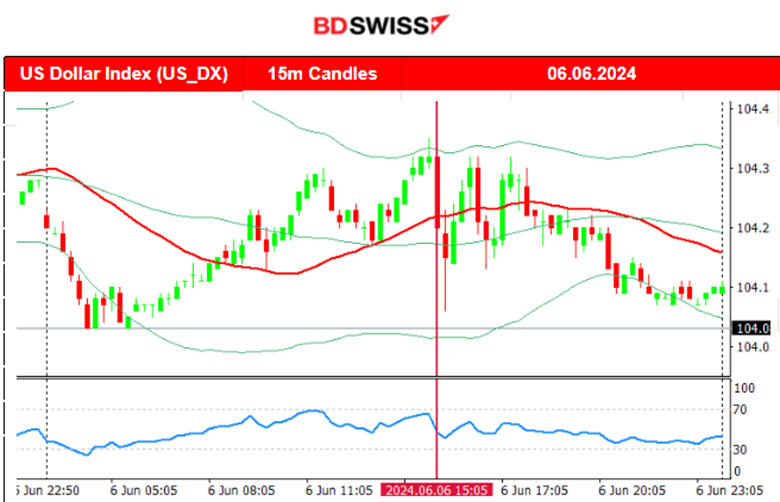
ECB: Staff now see headline inflation averaging 2.5% in 2024, and 2.2% in 2025. With these projections, the EUR is maintaining its value against other currencies. The market reacted with EUR appreciation at first upon release, which soon faded and in general, kept the EUR in balance. EURUSD stayed in a 30 pips range.
At 15:30 the U.S. unemployment claims were reported higher than expected beating expectations by 9K. The 229K figure caused USD depreciation at the time of the release but the impact was not great.
General Verdict:
 __________________________________________________________________
FOREX MARKETS MONITOR
EURUSD (06.06.2024) 15m Chart Summary
Server Time / Timezone EEST (UTC+03:00)
Price Movement
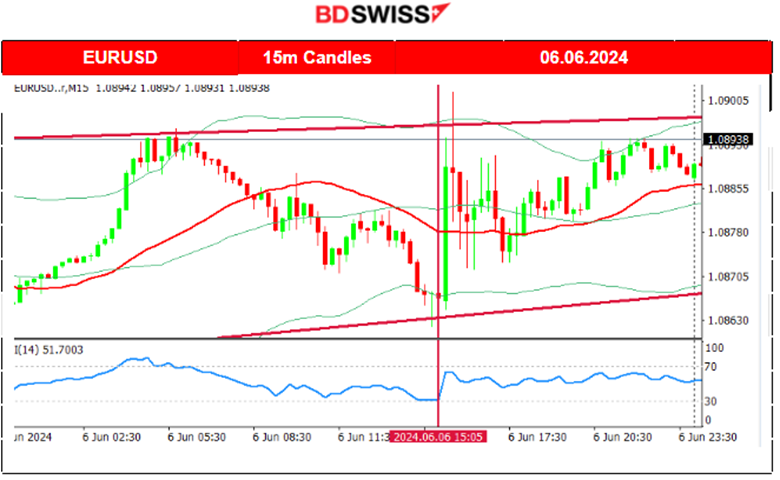
The pair started to move early to the upside as the dollar experienced a sudden depreciation during the Asian session. The pair reversed to the downside as the start of the European session was approaching and steadily moved to the support near 1.08630 while the dollar was experiencing appreciation before the ECB news. After the news, the EUR appreciated causing the EURUSD to jump 30 pips. The lower than expected unemployment claims caused USD depreciation keeping the EURUSD high and after reaching the intraday range limit it eventually reversed to the downside, kept in balance and close to the 30-period MA.
 ___________________________________________________________________
CRYPTO MARKETS MONITOR
BTCUSD (Bitcoin) Chart Summary 1H
Server Time / Timezone EEST (UTC+03:00)
Price Movement
After a period of consolidation taking place last weekend, the price broke the resistance and moved to the upside. It stalled at the resistance near 69K USD even after the volatile market conditions that took place on the 3rd during the PMI releases. Since the 3rd of June, Bitcoin gained momentum and moved to the upside. It steadily broke resistance levels, 68K, 69K, 70K and lastly 71K at the level that is currently settled.
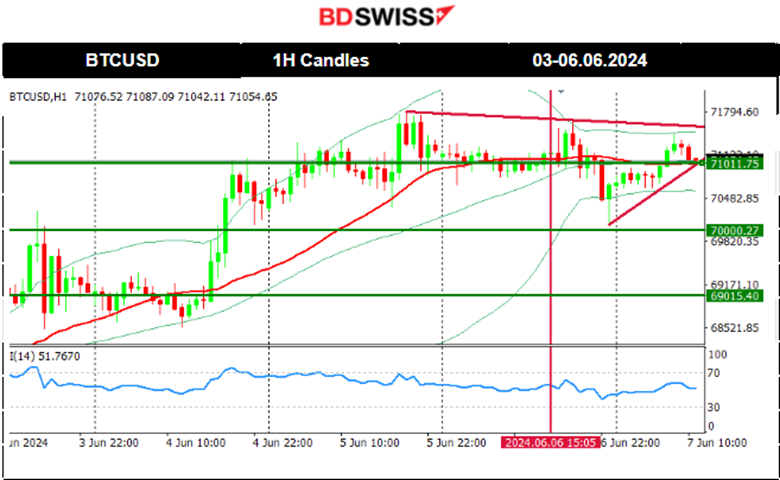 Crypto sorted by Highest Market Cap:
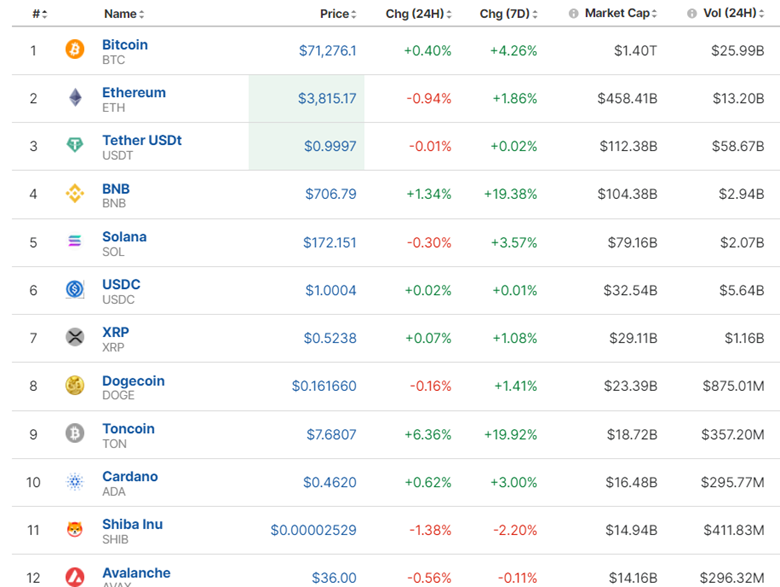
Cryptos saw great improvement. The market changed amid major releases this week. Prices remained high and 7-day period gains have been sustained so far.
Sources:
https://www.investing.com/crypto/currencies
______________________________________________________________________
EQUITY MARKETS MONITOR
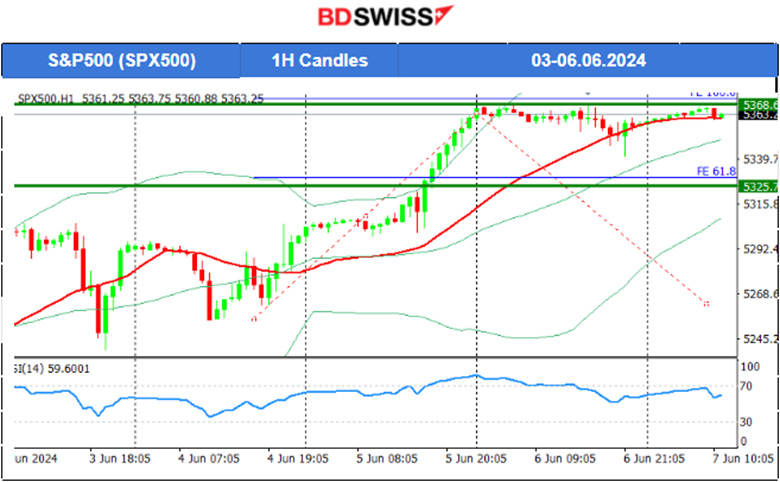
S&P500 (SPX500) 4-Day Chart Summary
Server Time / Timezone EEST (UTC+03:00)
Price Movement
A triangle formation started to form and on the 4th of June, a breakout to the upside took place. The upward movement after the breakout took place and the index reached higher and higher levels. Now we have to have eyes on the RSI and look for bearish signals as retracement is possible after this rapid upward movement. It is clear that the market is overbought considering the 50-period Bollinger bands and the RSI. It is just the fact that the NFP will distort the technical analysis. Maybe the market will eventually react in such a way that mean reversion will take place but is quite uncertain.
 ______________________________________________________________________
COMMODITIES MARKETS MONITOR
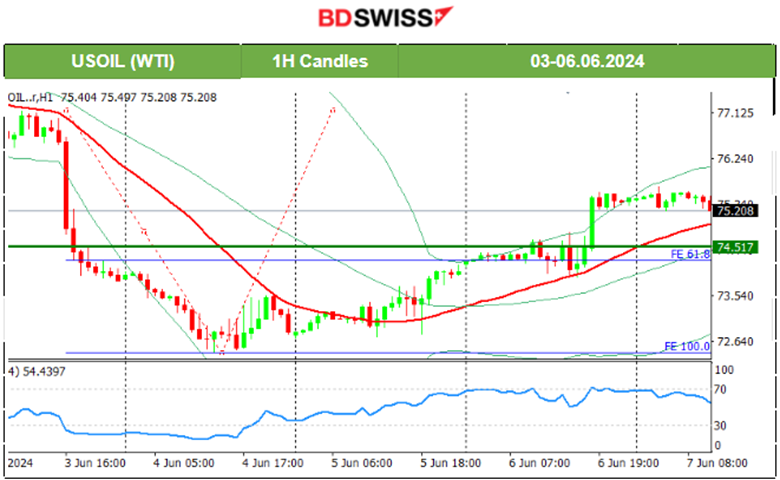
USOIL (WTI) 4-Hour Chart Summary
Server Time / Timezone EEST (UTC+03:00)
Price Movement
Despite OPEC+ production cut extension oil prices fell rapidly on the 3rd of May. Around a 5-dollar drop was recorded in the price of Crude oil since the drop. The H4 chart showed that the price was on the lower band of the 50-period Bollinger Bands indicating a strong support there. The price of crude oil eventually retraced as mentioned in our previous analysis. It was a long way down and the RSI indicated a slowdown and possible bullish divergence increasing the chances for retracement. Retracement reached the 74.5 USD/b level on the 6th of June and moved further to the upside after the release of the higher unemployment claims for the U.S.
 XAUUSD (Gold) 4-Day Chart Summary
Server Time / Timezone EEST (UTC+03:00)
Price Movement
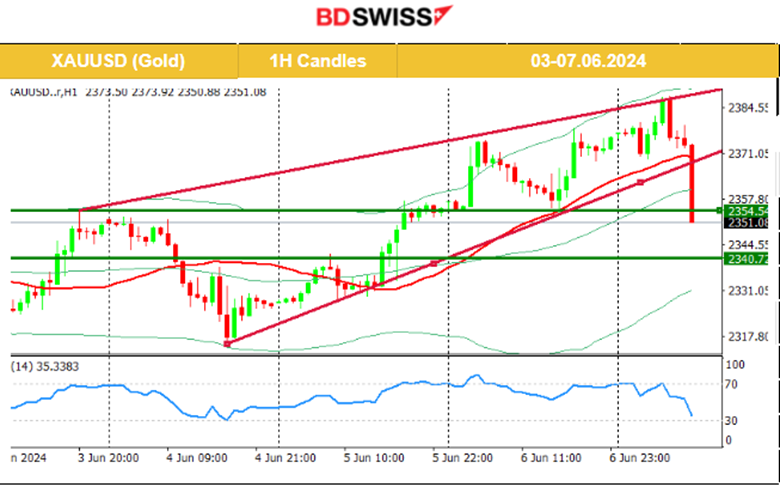
The level 2,340 USD/oz served as the mean price until the 31st of May with the price deviating around 20 dollars from that mean. The price broke the support at nearly 2,320 USD and with the potential to move further downwards. However, it stalled after the breakout, indicating that there are upward pressures that keep the support strong. On the 3rd of May, the dollar suffered strong depreciation helping Gold to climb. Gold was moving sideways around the mean near 2,340 USD/oz and deviating 20 dollars from the mean. On the 5th of June, it jumped, breaking from the triangle formation as depicted on the chart, and moving upwards, reaching 2,375 USD, before retracement took place. The price continued to move higher and a triangle formed as depicted on the chart. That triangle was breached today, the 7th of June, and Gold saw a sudden drop of 20 dollars passing the first support, indicating an uptrend stop, with the potential to move lower before the NFP.
 ______________________________________________________________
News Reports Monitor – Today Trading Day (07.06.2024)
Server Time / Timezone EEST (UTC+03:00)
- Midnight – Night Session (Asian)
No important news announcements, no special figure releases.
- Morning – Day Session (European and N. American Session)
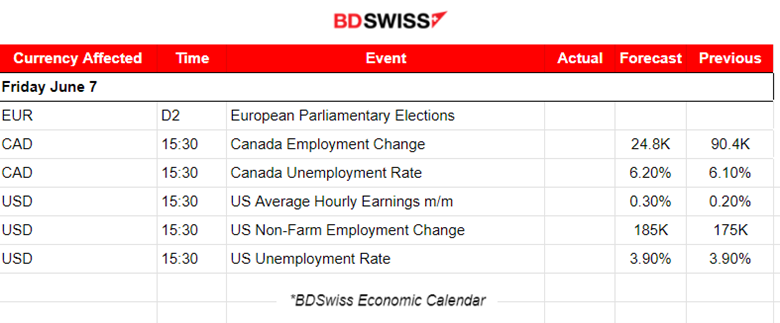
At 15:30 the major labour market data for Canada and the U.S. will be released.
The market expects lower figures for employment change and higher for the unemployment rate in Canada. Labour market cooling is something logical for analysts to expect. BOC already cut rates, suggesting that they had strong “cooling” data and forecasts enough to support their decision.
The NFP figure is expected to be reported higher while the unemployment rate is not expected to change. It is true that economic data so far support an increase (check ISM PMIs) as business is showing signs of moderate strength. NFP close to forecast is somehow excused but a lower-than-expected figure is highly unlikely to take place.
The U.S. dollar is barely affected at this time, trading GOLD futures pre-NFP causes the price to plunge downwards, about 30 dollars so far.
General Verdict:
______________________________________________________________


