Looking at the economic indicators nowadays is like watching a horror movie: As the heroine goes into the house where the killer is waiting, she’s smiling, laughing, talking on her phone, oblivious to the fate that awaits her in a few moments. But we the viewers all know what’s about to happen, and that’s what causes us to recoil in horror. “Don’t go in! Don’t go in!” we shout. But she always does.
The economic indicators that we’ve been seeing show the same relentless march to disaster. German retail sales were up 1.2% mom in February, above January’s level and smashing the forecasts. Hey, great! But what does that say about March’s likely level, when we all know that Germany was in lockdown for around the last 10 days of the month and won’t get out until 20 April at the earliest?
Repeat the same for every country in the world, more or less…
How long will it go on? There’s starting to be some hope. Some countries have started to “bend the curve” on the virus, in that the rate of increase is slowing. There’s been some progress on a vaccine, and some existing medicines are showing promise at treating COVID-19. But we don’t know anything for sure. As Dr. Anthony Fauci, director of the US National Institute of Allergy and Infectious Diseases, said, “You don’t make the timeline, the virus does.”
Nevertheless, the debate about the shape of the recovery has already started even though we have no idea when that’s going to be. Originally, analysts thought it would be a “V”-shaped recovery as happened in Southeast Asia after the SARS episode. The longer it drags on however and the deeper it goes, the less likely that seems – too much damage will have been inflicted on businesses and on workers’ incomes to see a sharp rebound. Too many companies will be out of business and too many jobs will be permanently lost, especially in the service industry, where lost expenditure is unlikely to be made up.
Then there’s a “U”-shaped recovery, where the virus drags on for longer but is still followed by a fairly robust rebound. Same reasoning makes this even less likely to me – the longer it drags on, the weaker the recovery is likely to be, in my view. Someone who picks up a coffee and roll every day on their way to work but doesn’t go to work for a month isn’t going to stop by the store on their first day back and buy 21 coffees and 21 rolls – if the store is even still in business by that time.
OK, now there’s talk of the “L”-shaped recovery, which is basically no recovery at all. The lockdowns remain in place indefinitely, particularly in the US, where the Trump mis-administration is presiding over an astonishing disaster of planning – where’s Michael Brown* when you need him? I think there’s more than a negligible chance of this occurring if the US fails to get its pandemic under control. The phrase “when the US sneezes, the rest of the world catches a cold” has some morbid truth in this situation. The US buys $1.37tn worth of imports from the developing world and $1.17tn from the advanced economies. A continuing deep recession in the US would make it difficult for other countries to fully recover. Not to mention the impact that putting travel restrictions on movement in and out of the US would have.
*Michael Brown was the incompetent head of the Federal Emergency Management Agency (FEMA) who bungled the government’s response to the 2005 Katrina hurricane in New Orleans. President Bush famously commended him for doing “one heck of a job, Brownie” a few weeks before firing him.
The “tic-mark”-shaped recovery. Like the “Nike swoosh,” the rapid decline is followed by a more gradual recovery. This seems more likely to me as various places come out of lockdown at different rates, slowly fuelling a global recovery. This is probably my central case. This would probably mean a FIFO market for currencies: first in, first out. Those regions that took the first steps to deal with the crisis would be the first to recover, as would their currencies. The commodity currencies might be the big beneficiaries of this kind of recover if it means that China, the first country in – and the world’s biggest consumer of commodities – was also the first out.
But that brings up the unpleasant possibility of the “W”-shaped recovery: countries where the virus has died down lift their measures, only to find the virus breaking out again, forcing them to go through the whole process again. We just don’t know if the virus will confer “herd immunity” or whether people can get infected a second time. The data from China so far is worrying, to me at least, but then again I tend to worry a lot.
But why limit ourselves to the Roman alphabet? For example, there are lots of possibilities in the two Japanese alphabets with their 46 letters each. Somewhere between a “V” and a “U” you have a shi し recovery, which would be a precipitous decline followed by a struggling recovery in which the economy fails to get back to its former level of output. That’s what I think is most likely, as many businesses are likely to disappear and jobs will be lost permanently. Even when the pandemic is largely over and there’s a vaccine – which apparently will take a year or more, from what I read – it will take much longer than that to rebuild the businesses that have been lost and the jobs that they created. Especially so in the US, where the aim seems to be to support individuals. Europe may wind up in better shape as the focus there (at least in Germany and France) seems to be on enabling companies to maintain employment over this period, so that the economic landscape is likely to look pretty much like it does today when we finally exit from this ghastly period.
We could see a recovery like the letter he へ , which would be a gentle recovery that fails and slides back into recession. Or so そ, which would be two attempts at recovery, each one failing, with the economy finally slipping into deep, long-lasting recession. The worst case scenario would be a noh の, which would be everyone just going around in circles and finally ending up at a standstill. I fear that this may be the outlook for the US, unfortunately.
I’m sure readers in other countries could add to our economic vocabulary. Perhaps some Thai economists, expecting a drawn-out, convoluted path for the global economy, are looking for a ฐ–shaped recovery? Please send me your suggestions!
A BIS paper explaining the sudden demand for dollars
You may be puzzled by the recent strength of the dollar in the face of the COVID-19 virus, particularly against the yen, which is known as a “safe-haven” currency that tends to appreciate during times of uncertainty. The Bank for International Settlements (BIS) yesterday published a paper explaining everything. It’s entitled “Dollar funding costs during the COVID-19 crisis through the lens of the FX swap market.” It’s a fairly technical paper that’s written for market practitioners, not the casual public, so it may be rather hard going for some readers. The key point though is quite simple:
…Asia’s life insurers (including in Japan) hold somewhere between $1.5 trillion and $2 trillion in foreign currency bonds (mostly dollar-denominated)…the bulk of the FX
hedging instruments used in such portfolios have short maturities. Hedging a $2 trillion dollar portfolio that is, say, 80% dollar-denominated with a 60% hedge ratio using three month swaps would require rolling $960 billion in dollar swaps every three months, or $320 billion every month
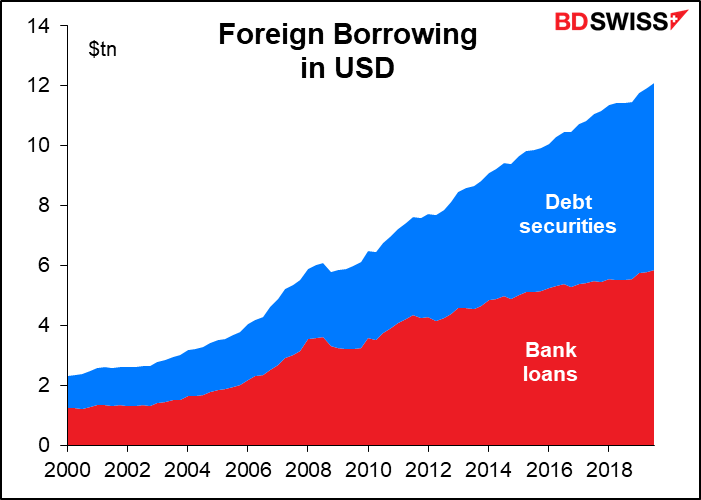
The fact is, it’s not just Asian borrowers with $2tn in USD assets – globally, the world has borrowed $12.1tn in USD ($5.8tn in bank loans, $6.2tn in debt securities). That’s a lot of hedges to roll over every month and explains a lot of the scramble for dollars – and why the Fed’s moves to ease the overseas supply of dollars through swap lines with central banks and now the new repo facility – have gone a long way towards filling that demand and taking upward pressure off the dollar.
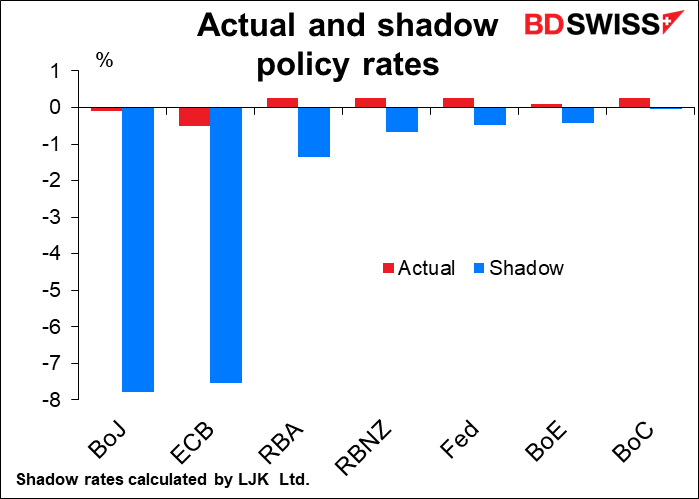
Shadow policy rates
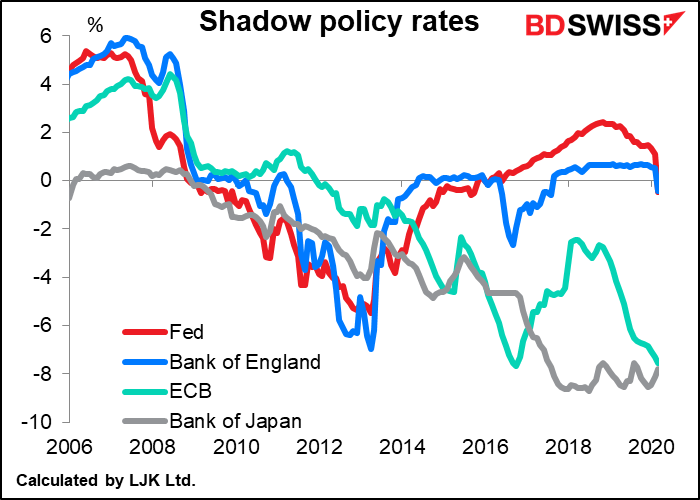
Which central bank has the loosest monetary policy? When the only tool they employed was their policy rate, it was easy to tell. Now however with many central banks using unconventional measures, such as quantitative easing and various lending programs, it’s not so easy to tell. One bank at 0.25% but buying a lot of bonds further out the curve may have a bigger impact on monetary conditions than a bank with negative short rates but no bond-buying program.
Academics and market practitioners have developed what’s called the “shadow policy rate” to take such unconventional measures into account and gauge the impact of monetary policy at and below the zero bound. These measures give a truer measure of where policy rates actually are. The project is now being run by Dr. Leo Krippner, a senior advisor at the Reserve Bank of New Zealand. He updates the data at the end of every month, so I thought I’d take a look at it.
The data show that:
- The effective interest rates in all the major central banks are now negative;
- The ECB has eased policy significantly over the last two years even though the deposit rate has only come down by 10 bps;
- The RBA and RBNZ have been very aggressive in their easing;
- The Bank of Canada still has plenty of room to ease further; and
- Japan’s recent moves were not as significant as they appeared; on the contrary, their shadow rate has risen a little bit (although it remains the lowest of all, by a tiny margin).
Next week’s indicators: who cares?
The second week of the month is usually light on indicators. Next week it’s even worse than usual, as Friday is Good Friday, a holiday in much of Europe, Australia, New Zealand, Canada, and some parts of the US economy (although not the Federal government).
There’s only one central bank meeting, the Reserve Bank of Australia (RBA), but their interest rates are already as low as they’re going to go, according to Governor Lowe.
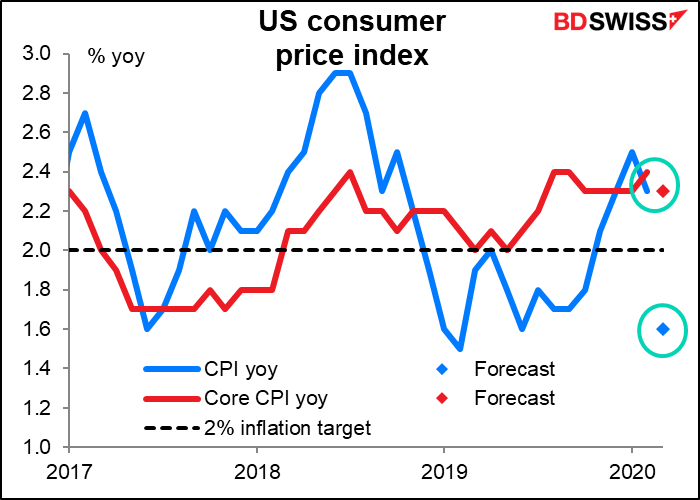
The major indicator of the second week is usually the US consumer price index (Friday), which is important in normal times because of its impact on the future path of Fed policy. But Fed policy is now going to be determined by the strength of the economy, and that’s going to be determined by the course of the virus. See Dr. Fauci above.
In any case, the headline CPI is forecast to slow dramatically, probably because of plunging oil prices. But core inflation, which is what the Fed targets, is forecast to remain pretty much where it’s been since October. (In fact, core inflation has been between 2.0% – 2.4% yoy since March of 2018.)
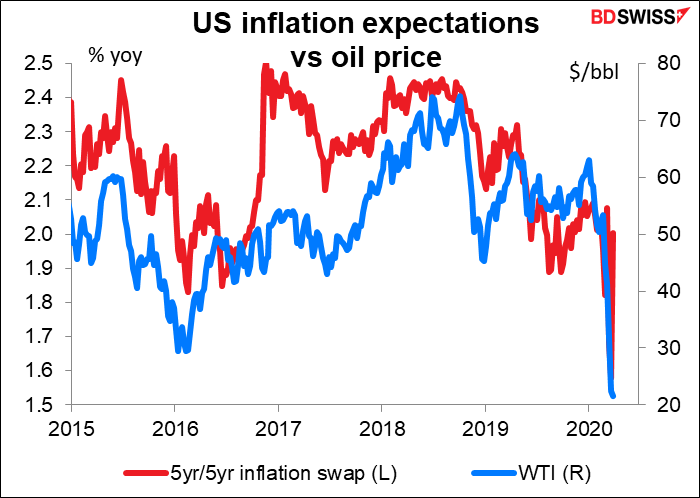
While core inflation remains steady in the face of plunging oil prices, the same can’t be said for inflation expectations. Inflation expectations have been plunging along with oil. Ordinarily that would be a big worry for the Fed, which doesn’t want to see inflation expectations get unanchored. But I think that’s just one part of the big problem of the economic apocalypse the Fed is trying to deal with.
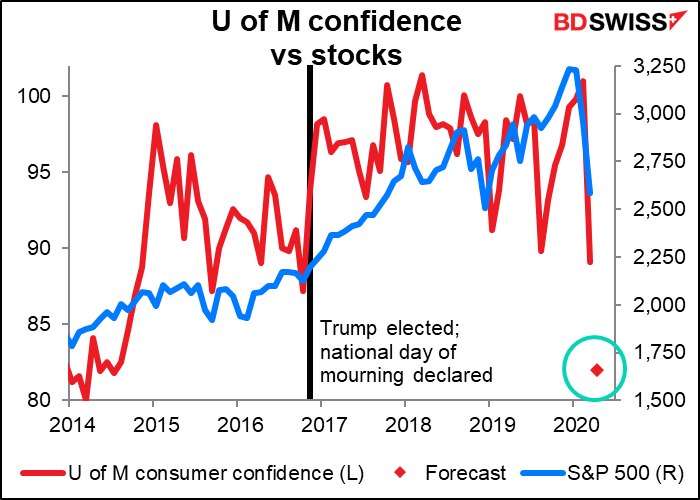
The University of Michigan consumer confidence index (Thursday) is expected to lose the last of the post-Trump bubble in confidence as the post-Trump stock market rally unravels. Plunging consumer confidence is a common theme across countries nowadays. No surprise there.
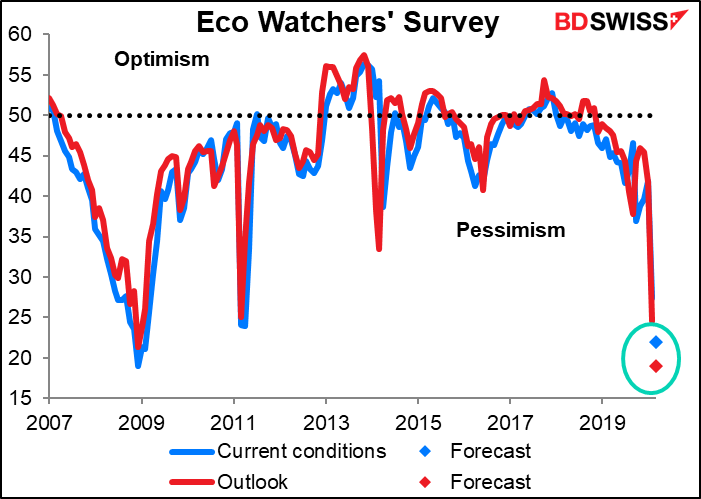
Japan’s eco watcher’s survey (Wednesday) is a survey of so-called “grassroots” people who work largely in consumer-facing jobs, such as taxi drivers, convenience store managers, barbers, sales clerks, pachinko parlor operators, and other people who deal directly with the public. It’s the ultimate service-sector indicator. The graph shows that it’s been plunging. This month the level of pessimism is expected to surpass that of the Tohoku tsunami in 2011 and equal that of the Global Financial Crisis in 2008.
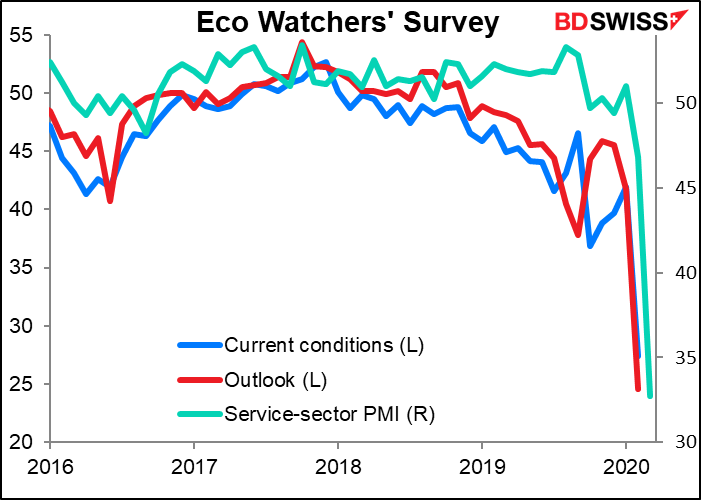
It’s interesting to me how closely the Japan service-sector purchasing managers’ index (PMI) tracks this indicator, but how much earlier the eco-watcher’s survey turned down. Apparently it took some time for reality to filter up to the purchasing managers. This may be one reason why people don’t pay as much attention to the PMIs in Japan as they do in other countries. (Also the Japan PMIs track GDP much less closely than in other countries.)
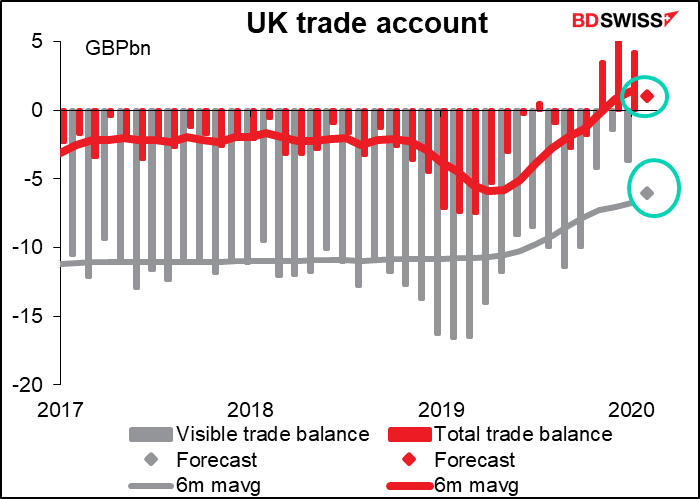
Britain’s short-term economic indicator day is Thursday. That’s the day we get GDP, industrial & manufacturing production, and trade, all at the same time.
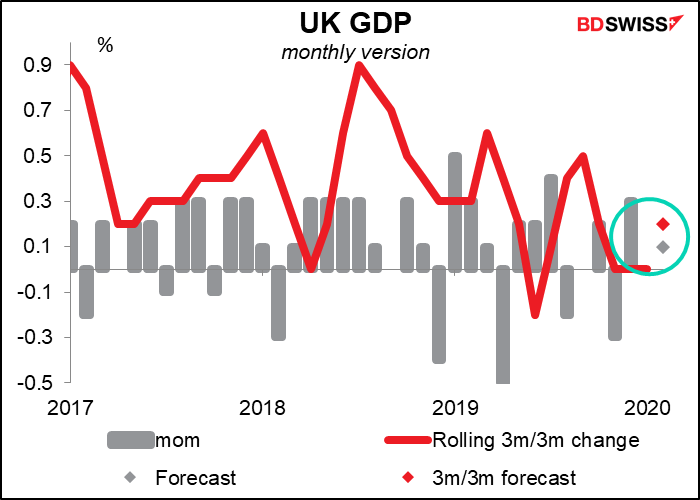
Britain didn’t go into the maelstrom in particularly robust shape. The 3m/3m change in GDP was zero for three consecutive months. January alone was 0% mom. For February, the country is expected to have just eked out a rather tepid +0.1% expansion. Probably the low level of growth was due to concerns over Brexit. Ha! How quaint and innocent those concerns seem now. There was talk of shortages of critical medicines, but no one dreamed that they’d be converting a London conference center into an emergency hospital, as has actually happened.
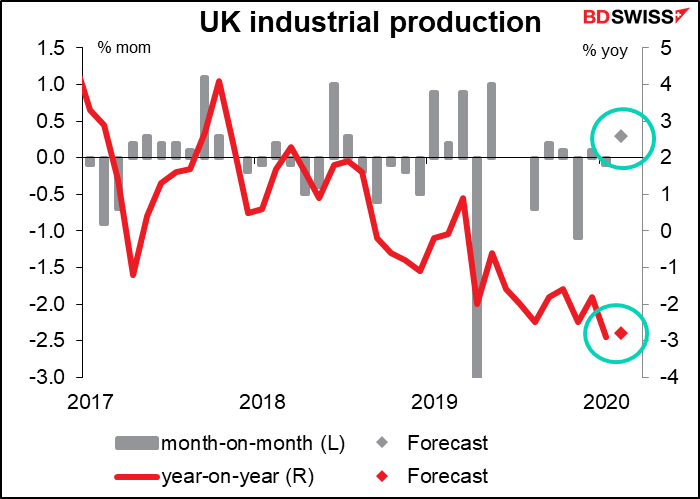
UK industrial production is forecast to show a small mom rise in February, but that would be just enough to keep the yoy rate of decline steady. Heaven knows what the March figure will look like.
And the total trade balance is expected to remain in surplus, although nowadays we have big questions about this data since it seems to be distorted by the movements in gold, which have been quite peculiar recently.
As for the RBA, they cut the cash rate by 25 bps at their regularly scheduled meeting 3 March and then held an emergency meeting on 19 March at which they
- cut the cash rate another 25 bps to 0.25%, effectively the bottom
- reinforced the impact of cut with aggressive forward guidance — promised to keep the cash rate at that level “until progress is being made towards full employment,” which in the current circumstances effectively means “indefinitely”
- instituted a form of Japan-style “yield curve control” by promising to target the yield on the benchmark 3-year Australian government bonds at around 0.25;
- introduced a term funding facility for the banking system with support for business credit, especially to small- and medium-sized businesses; and
- adjusted the interest rate on banking balances held at the RBA (a technical move).
RBA Gov. Lowe made a speech following the moves in which he made it clear that this is pretty much as far as the RBA wants to go. He said, “The term funding scheme and the three-year yield target are both significant policy developments that would not have been under consideration in normal times. They both carry financial and other risks for the Reserve Bank and they both represent significant interventions by the Bank in Australia’s financial markets.”
The shadow policy rates described above quantitatively corroborate Lowe’s view. According to the shadow policy rate calculations, the RBA’s new policy is the third-most aggressive among the central banks, after the ECB and the BoJ. That’s quite a rapid move for the Bank.
Accordingly, I would be very surprised if they announce any further measures at this meeting. I expect that they’ll review the measures, discuss how well they’re going, and wrap up with a statement about how the current measures “will support jobs, incomes and businesses through this difficult period and they will also assist the Australian economy in the recovery.”
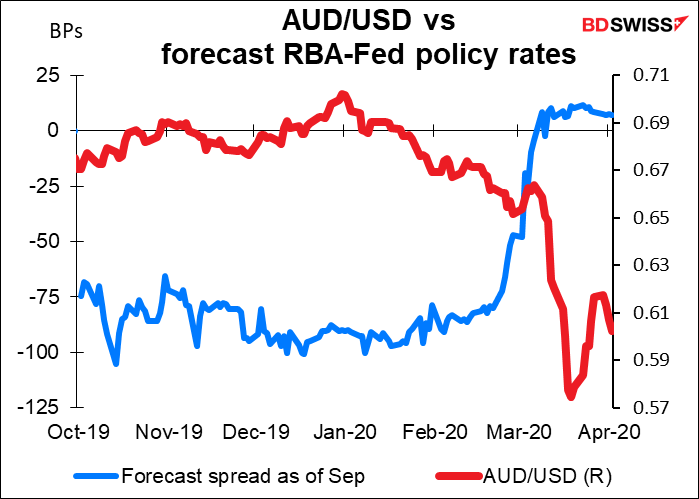
In any case, does it matter at this point for the FX market? Often currency pairs are driven by interest rate differentials, or more accurately by the expected change in interest rate differentials. In this case though AUD/USD has completely divorced from interest rates. The expected interest rate gap between Australia and the US this coming September – recently in favor of the US by 100 bps – has collapsed completely to the point where it’s now in favor of AUD by a couple of bps. Nonetheless, AUD/USD has collapsed. (I know, it looks like one of the Y-axes should be in reverse order, but it’s correct – I checked it.)
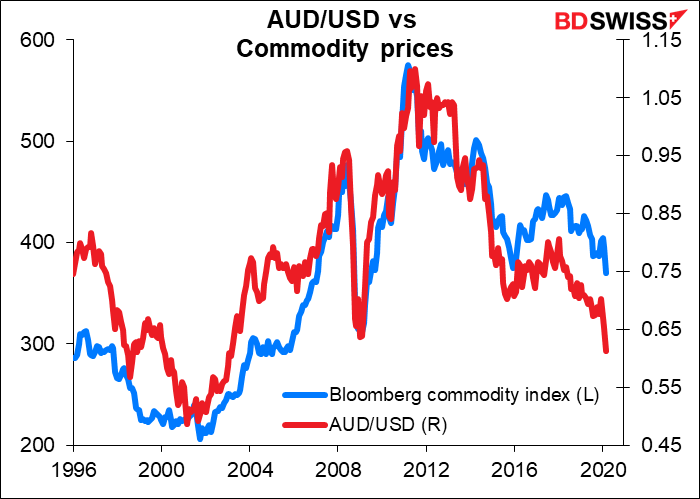
As a commodity currency, AUD/USD is being driven much more by global factors right now than it is by interest rate differentials. In that respect, we’ll probably have to have a better idea of at least when China might get fully back to work, and more likely see some “light at the end of the tunnel” for the pandemic before AUD can launch a sustainable recovery.
If anything, the RBA’s aggressive forward guidance and the yield-curve control measures make AUD suitable for a funding currency, if you could find any currency with higher interest rates for the other leg of the trade. (Answer: within the G10, only NZD.)