PREVIOUS TRADING DAY EVENTS – 18 Sep 2023
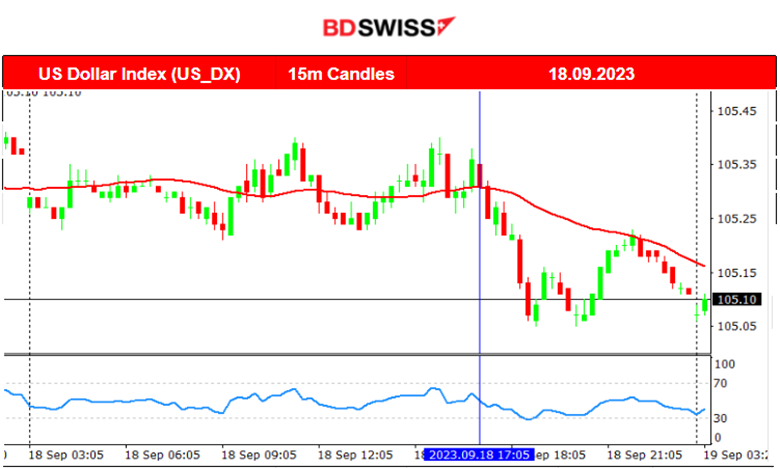
The CAD strengthened against the USD on Monday as investors grew more optimistic about the global economy and ahead of inflation data.
“The Canadian dollar is reflecting global growth optimism at the moment,” said Adam Button, chief currency analyst at ForexLive. “China last week stepped up with more stimulus, and American economic data continues to impress.”
“Canadians would love the central bank to declare that rate hikes are over. That’s not coming any time soon given the stickiness of inflation and the rise in energy prices,” Button said.
Source:
______________________________________________________________________
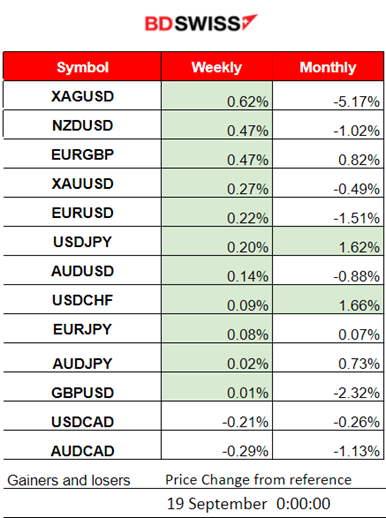
Winners vs Losers
______________________________________________________________________
News Reports Monitor – Previous Trading Day (18 Sep 2023)
Server Time / Timezone EEST (UTC+03:00)
- Midnight – Night Session (Asian)
No special news announcements or important scheduled figure releases.
- Morning–Day Session (European and N. American Session)
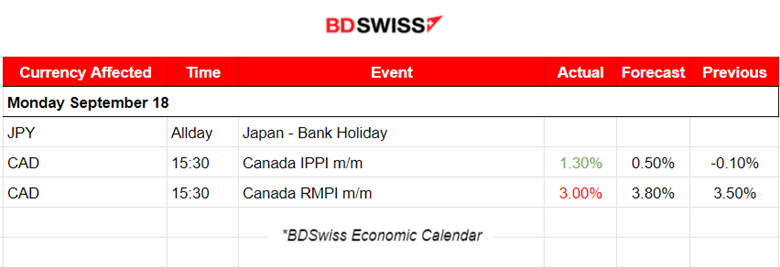
Change in the price of goods sold by manufacturers in Canada had some effect. CAD appreciated for a while intraday before retracing quickly. The monthly change for IPPI was reported higher, 1.3%.
General Verdict:
____________________________________________________________________
FOREX MARKETS MONITOR
EURUSD (18.09.2023) Chart Summary
Server Time / Timezone EEST (UTC+03:00)
Price Movement
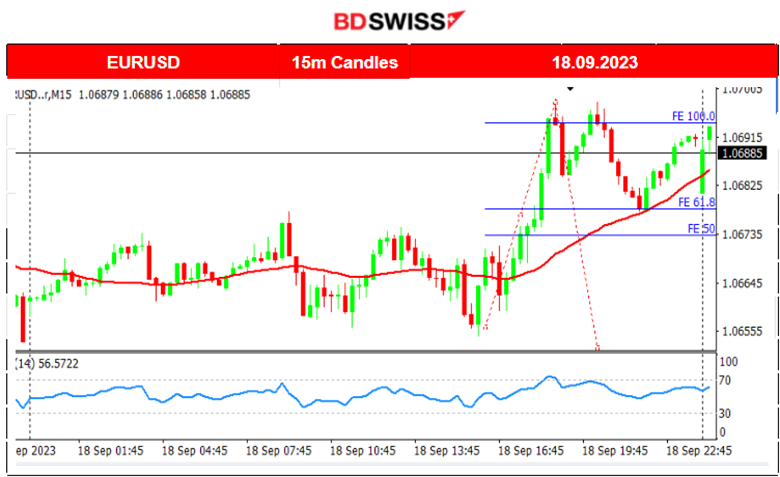
The pair was moving sideways around the mean until the start of the N. American session when eventually it experienced a shock to the upside. It found resistance at 1.070 before retracing back to the mean (30-period MA). That is the 61.8 FE as depicted.
USDCAD (18.09.2023) Chart Summary
Server Time / Timezone EEST (UTC+03:00)
Price Movement
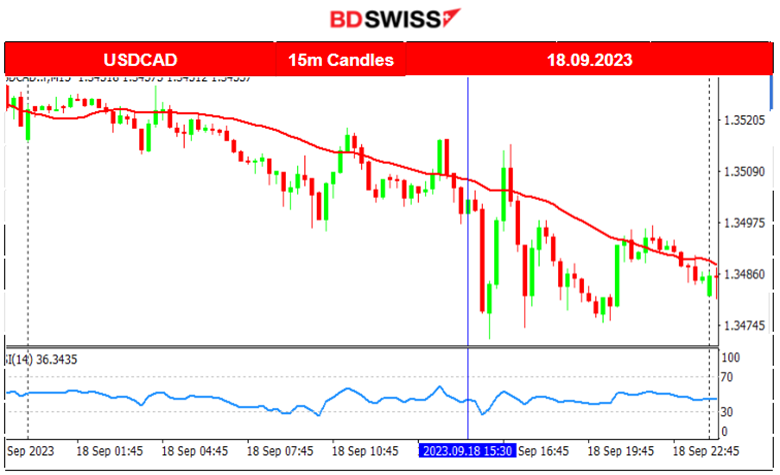
The pair was moving to the downside steadily experiencing low volatility until the scheduled releases. At 15:30 the reports for changes in prices in the manufacturing sector caused a shock with CAD appreciation. The pair moved rapidly to the downside and reversed soon back to the mean only to continue its volatile path.
___________________________________________________________________
CRYPTO MARKETS MONITOR
BTCUSD (Bitcoin) 4-Day Chart Summary
Server Time / Timezone EEST (UTC+03:00)
Price Movement
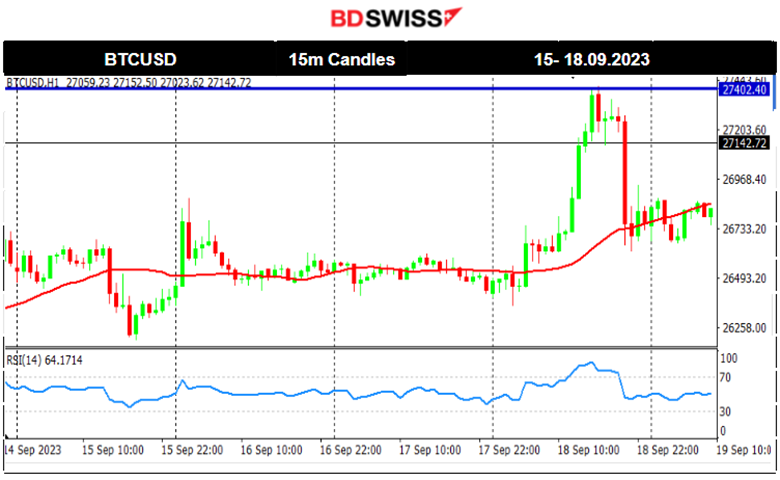
Bitcoin moved significantly upwards yesterday until it found resistance at 27400 USD before retracing almost fully back after 20:00. Its path is usually quite volatile and the reason for the current rapid movement is not the USD since the Dollar index was not significantly affected.
Crypto sorted by Highest Market Cap:
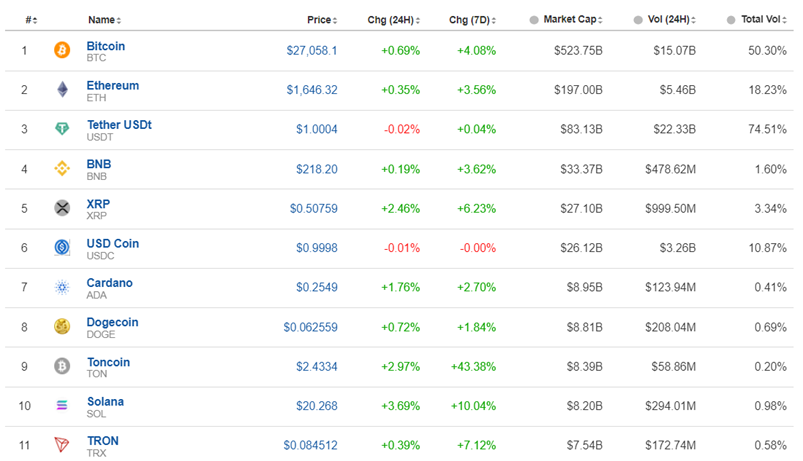
The last 7 days look good for Crypto. The path to the upside is not a steady one though. It experiences high volatility with reversals and that is why it will probably be subject to change soon. Toncoin leads with 43% gains so far in the previous 7 days while yesterday, Solana was the one leading with 3.69% gains (last 24 hours).
Source: https://www.investing.com/crypto/currencies
______________________________________________________________________
EQUITY MARKETS MONITOR
NAS100 (NDX) 4-Day Chart Summary
Server Time / Timezone EEST (UTC+03:00)
Price Movement
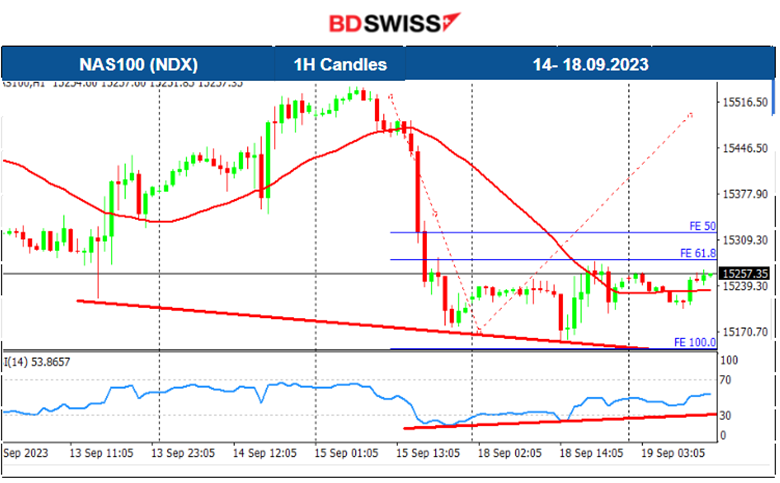
All the benchmark indices suffered a downfall on Friday. The market is quite volatile for stocks. Businesses see high costs as U.S. oil is moving higher and higher, inflation is still moving upward according to the latest report and a risk-off mood is probably dominating at the moment. A retracement took place after the market found support on the 18th of September and the price even reached 15270. It could be that on NYSE opening the retracement could continue, thus the price could move further upwards.
______________________________________________________________________
COMMODITIES MARKETS MONITOR
USOIL (WTI) 4-Day Chart Summary
Server Time / Timezone EEST (UTC+03:00)
Price Movement
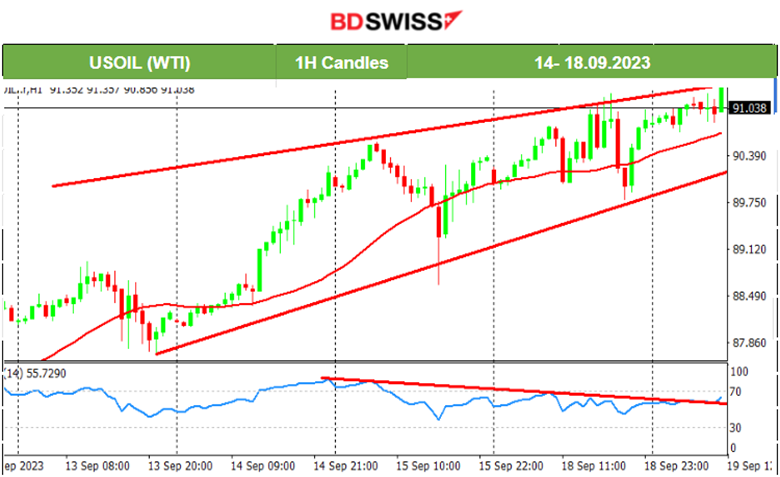
Crude price has been following a long-lasting upward trend and is now over 90 USD/b. It remains above the 30-period MA even though it moves with high volatility. RSI suggests that the price might test that level again since it forms a bearish divergence. Both metals and oil experienced this remarkable demand lately and have similar upward paths.
XAUUSD (Gold) 4-Day Chart Summary
Server Time / Timezone EEST (UTC+03:00)
Price Movement
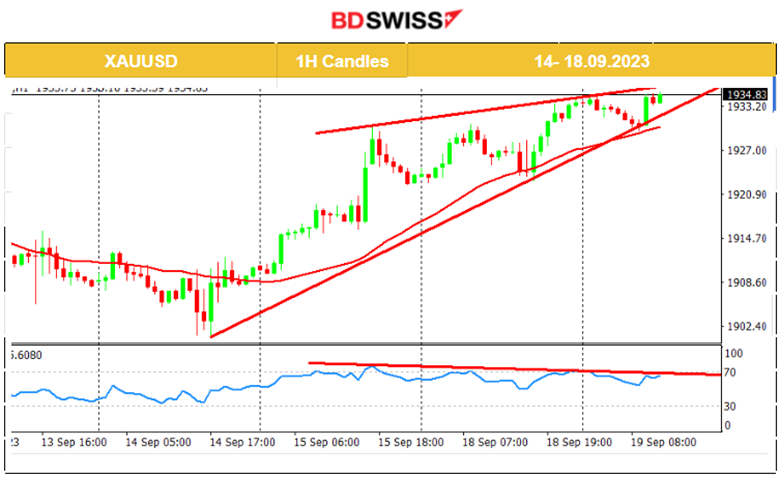
Gold started to move significantly upwards since the 14th, reversing and crossing the 30-period MA as it went upwards. There is an obvious increase in demand for metals and that keeps the price going to the upside. However, will it last long? Technically, the RSI is showing lower highs indicating a bearish divergence.
______________________________________________________________
News Reports Monitor – Today Trading Day (19 Sep 2023)
Server Time / Timezone EEST (UTC+03:00)

- Midnight – Night Session (Asian)
“Members commenced their discussion of the global economy by observing that headline inflation had continued to ease in year-ended terms in most economies because food and energy commodity prices were generally lower than they had been a year earlier. More recent increases in some food and energy prices presented upside risks to headline inflation in the months ahead. Nevertheless, many central banks in advanced economies expected inflation to moderate further and return to target during 2025.”
https://www.rba.gov.au/monetary-policy/rba-board-minutes/2023/2023-09-05.html
The RBA considered a rate hike but decided to pause instead. It is determined to return the inflation rate to the target within a reasonable time period.
- Morning–Day Session (European and N. American Session)
The news at 15:30 is probably going to cause a shock for CAD pairs. These are inflation-related data and affect the decisions of the Bank of Canada. The monthly CPI figure is expected to be reported lower. A surprise to the upside will probably cause the CAD to appreciate significantly intraday.
General Verdict:
_____________________________________________________________


