In the USD/CHF Monthly timeframe, there’s a line showing the upward direction of prices. It started at the lowest point of 0.70677 and went up to touch a higher low at 0.87611. This line indicates a strong upward trend.
But things changed when the market turned around and went down, breaking that upward line. Then it went back up to test the line at 0.92416. After this test, the market went down again, suggesting a probable downtrend. In the bigger monthly picture, it looks like the market is leaning towards selling.
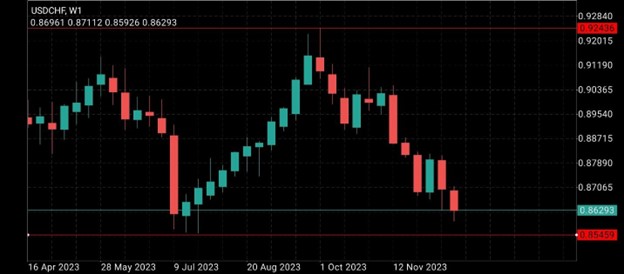
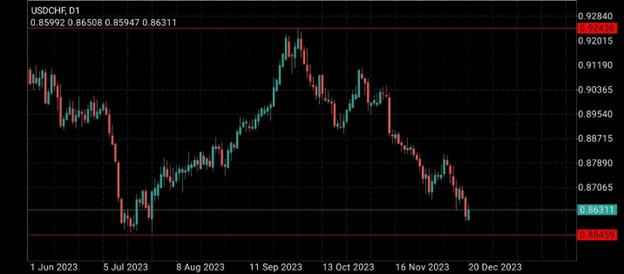
Now, if we check the shorter timeframes like Weekly and Daily, the market seems to be moving between a strong resistance at 0.92436 and a solid support at 0.85459. Currently, the price is around 0.86291, getting closer to that support level.
If the price breaks below this support, there’s a good chance the market will keep going down until it finds a new support. On the other hand, if the support holds and doesn’t let the price go lower, the market might move up towards the 0.87611 level, which is currently acting as a strong resistance.
For smart traders, it’s crucial to match their analysis with information from Monthly, Weekly, and Daily reviews. This helps them really grasp how the market is behaving, making informed decisions that align with the ongoing trends.
In simple terms, when we look at the USD/CHF currency pair, it tells a story about how trends are changing or staying the same. The Monthly view gives us the big picture, showing a trend going down. Meanwhile, the Weekly and Daily views add details, showing that the market is kind of stuck between certain high and low points. Right now, the price is moving towards an important low point. Traders are in a tricky spot where they need to use their analyzing skills to make smart decisions and handle what’s happening in the market.


