PREVIOUS TRADING DAY EVENTS – 27 March 2023
Announcements:
Source: https://www.bloomberg.com/news/articles/2023-03-27/
Source: https://www.bloomberg.com/news/articles/2023-03-27/
Source: https://files.constantcontact.com/668faa28001/0831ba1c-0892-413e-9206-e7dc139dc4ca.pdf
______________________________________________________________________
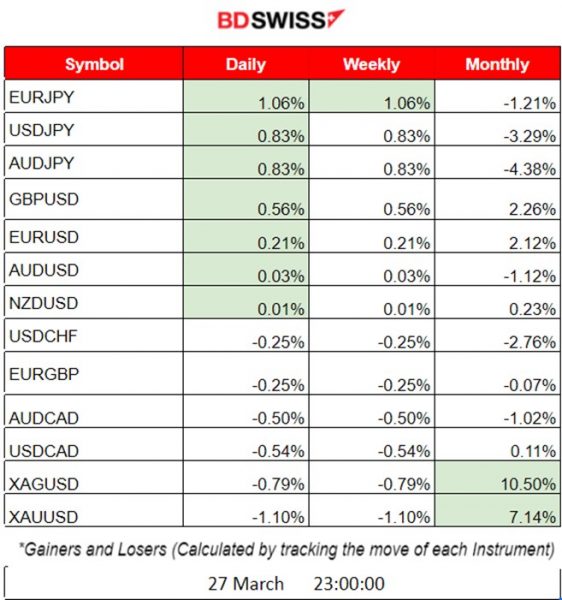
Summary Daily Moves – Winners vs Losers (27 March 2023)
______________________________________________________________________
News Reports Monitor – Previous Trading Day (27 March 2023)
Server Time / Timezone EEST (UTC+03:00)

- Midnight – Night Session (Asian)
No important figures/release > No major impact.
- Morning – Day Session (European)
No significant news or scheduled important figure releases. Volatility was expected from fundamentals as the markets are shaking due to the recent U.S. Banking Crisis.
General Verdict:
– No major shocks but some volatility.
– Speech from the BoE Governor could cause some volatility during the North American trading session.
______________________________________________________________________
FOREX MARKETS MONITOR
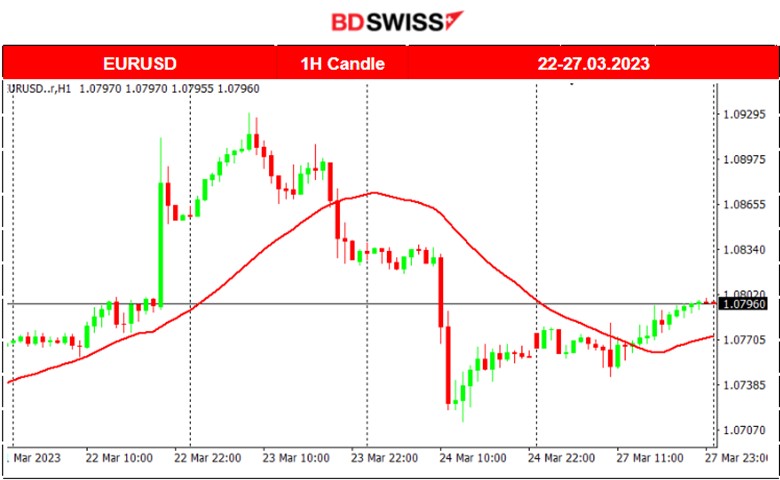
EURUSD 4-Day Chart Summary
Server Time / Timezone EEST (UTC+03:00)
Price Movement
Mainly driven by the USD, the EURUSD price was experiencing volatility moving around the 30-period MA. While the USD was affected by PMI figures, central banks’ decisions and the overall steps taken to counter the banking crisis, the pair was experiencing intraday shocks. After the sharp downward move on the 24th of March due to the USD appreciation following the positive PMI figure changes, the pair reversed and again crossed the MA on the 27th, steadily moving upwards over the MA.
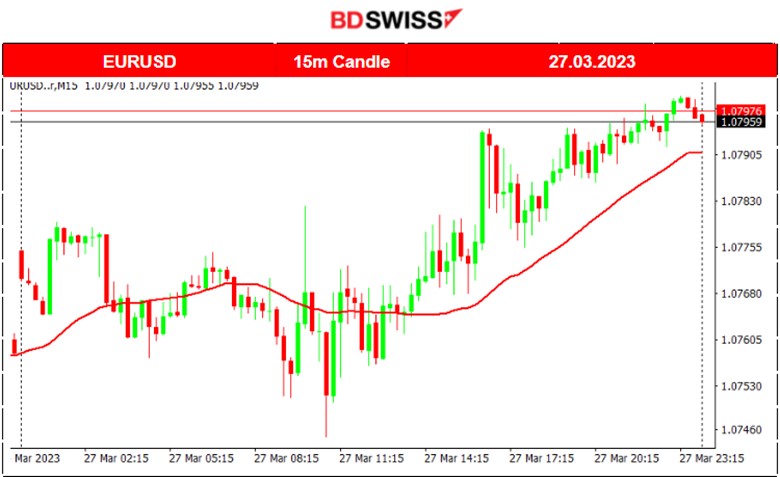
EURUSD (27.03.2023) Chart Summary
Server Time / Timezone EEST (UTC+03:00)
Price Movement
EURUSD did not experience much movement yesterday since there were no important scheduled releases. Only after the European/North American Session did it start to show an intraday upward trend while moving steadily above the 30-period MA.
Trading Opportunities
No shocks or scheduled releases, so no opportunities were created. Mondays usually experience low volatility unless scheduled news is in place.
______________________________________________________________________
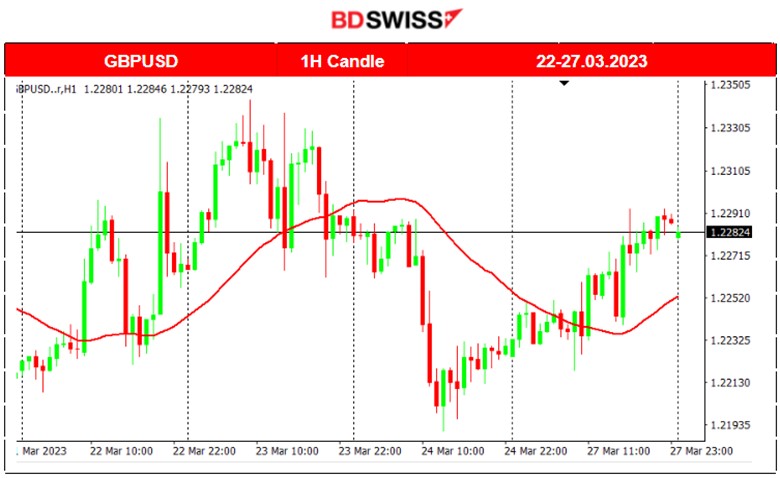
GBPUSD 4-Day Chart Summary
Server Time / Timezone EEST (UTC+03:00)
Price Movement
The GBPUSD moved roughly the same as EURUSD the past few days due to the fact that the USD was the main market driver. A sharp drop occurred on the 24th of March due to the USD appreciation following the positive PMI figure changes. The pair reversed crossed the MA on the 27th and kept moving upwards over the MA.
GBPUSD (27.03.2023) Chart Summary
Server Time / Timezone EEST (UTC+03:00)
Price Movement
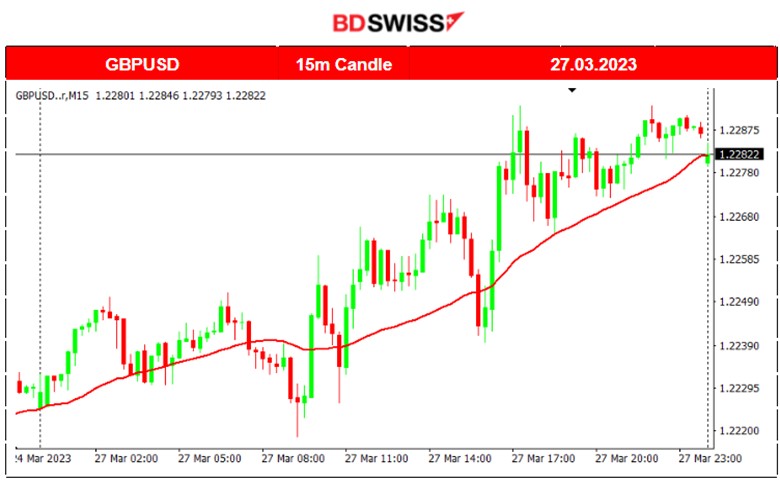
GBPUSD price movement yesterday was all intraday uptrend. The pair was moving over the 30-period MA in all trading sessions with an overall movement of nearly 60 pips for the day. The BoE Governor gave his speech during the North American session with positive comments and expectations regarding the economic conditions and banking system.
Trading Opportunities
No shocks or scheduled releases, so no opportunities were created. Even if an intraday trend is identified, catching short reversals is rather difficult. However, in case of an uptrend, the trades should be placed when the price is below the MA or very near it.
______________________________________________________________________
EQUITY MARKETS MONITOR
NAS100 (NASDAQ – NDX) 4-Day Chart Summary
Server Time / Timezone EEST (UTC+03:00)
Price Movement
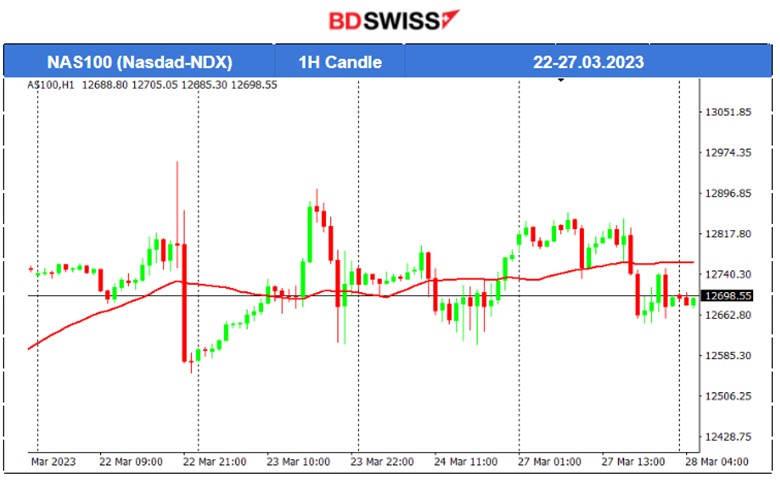
The Nasdaq-100 price has been characterised as volatile the past few days following the turmoil in the banking sector. It moves sideways around the mean with an overall direction to end up slightly upwards. Deviations from the mean are 150-170 USD with that number slowly getting lower to 100 USD recently.
NAS100 (NASDAQ – NDX) (27.03.2023) Chart Summary
Server Time / Timezone EEST (UTC+03:00)
Price Movement
Nasdaq-100 price was moving above the 30-period MA during the Asian session but soon started to show volatility and moved sideways during the European session. It fell on the NYSE market, opening by 160 USD and then retracted back to the mean.
Trading Opportunities
The Shock ended around 18:00 and created an opportunity for catching the retracement, which was about 80 USD.

______________________________________________________________________
COMMODITIES MARKETS MONITOR
GOLD (XAUUSD) 4-Day Chart Summary
Server Time / Timezone EEST (UTC+03:00)
Price Movement
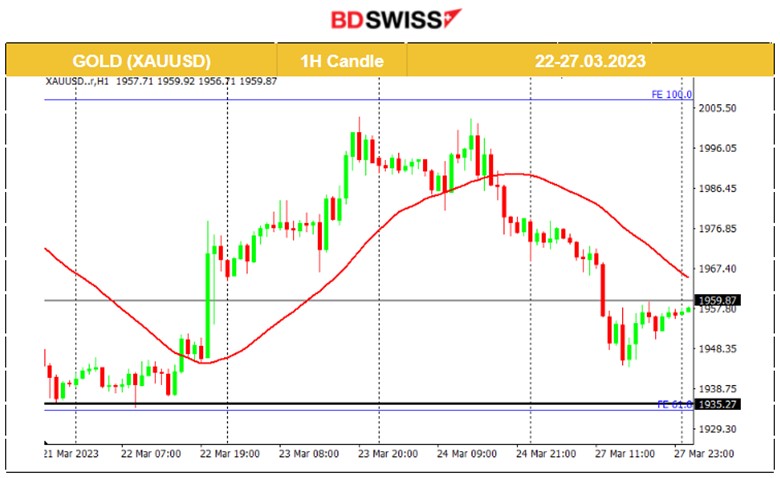
This month, Gold gained a lot of ground while at some point nearly reaching the 2000 USD price level. Investors and depositors lost confidence in keeping money in the banks and investing in risky assets, thus, buying gold in such an environment is expected. The price reversed sharply, starting from the 24th of March after reaching nearly 2000 USD. Analysts estimate that even though there is a decrease in the price now, the medium-term upward movement will continue.
GOLD (XAUUSD) (27.03.2023) Chart Summary
Server Time / Timezone EEST (UTC+03:00)
Price Movement
Gold price moved steadily downward yesterday during the Asian Trading Session and continued more rapidly in the same direction after the European Markets opening, with its CFD price reaching as low as 1944 USD/oz.
Trading Opportunities
This was not a shock in the market intraday so a retracement was not certain to occur as expected. The price moved along with the 30-period MA and it was not clear where the end of the downward movement was. However, looking back at previous resistance levels, it gave a good picture of where that would be. The retracement to 61.8% of the move indeed took place reaching the 1960 USD level.
Our analysis of TradingView:
https://www.tradingview.com/chart/XAUUSD/xjIz2lCD-XAUUSD-Drop-Retrace-27-03-2023/

USOIL (WTI) 4-Day Chart Summary
Server Time / Timezone EEST (UTC+03:00)
Price Movement
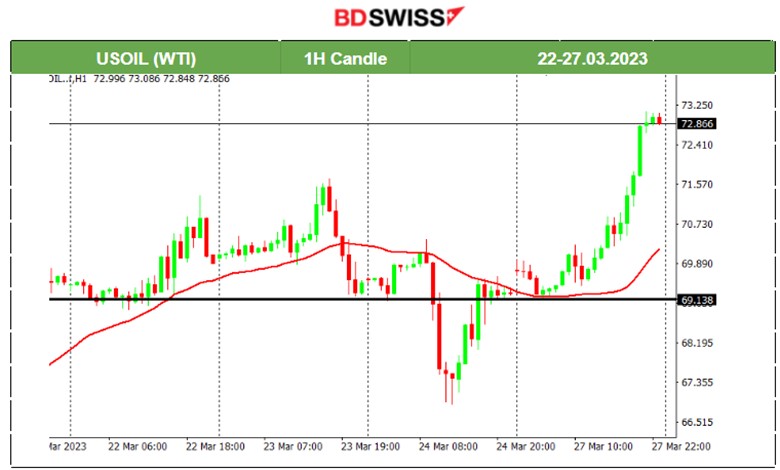
The U.S. Crude Oil price has experienced wide reversals due to extreme volatility over the past few days. The recent banking crisis is affecting the demand for Oil greatly. On the 24th, the CFD price of Crude Oil fell to 66.89 USD and reversed during the day back to the mean, at 70 USD. The next day, the reversal continued to the 72.8 USD level.
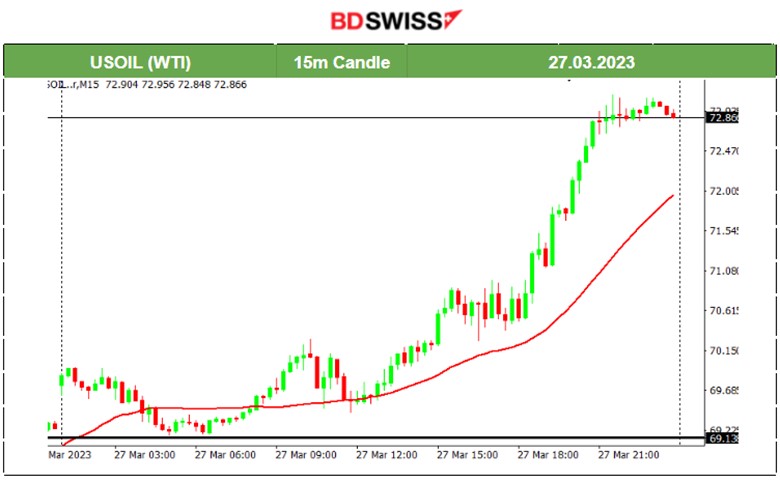
USOIL (WTI) (27.03.2023) Chart Summary
Server Time / Timezone EEST (UTC+03:00)
Price Movement
Yesterday, the price of Crude experienced extreme volatility and rallied sharply. Fears of a wider financial crisis due to bank collapses and buyouts seem to have faded. The price rose to nearly 73 USD/barrel.
Trading Opportunities
This was obviously a shock in the market with a 3 USD deviation from the 30-period MA (H1 Chart). It would be safe to assume that it will retrace on the 28th of March considering the volatility that it’s been experiencing recently.
______________________________________________________________
News Reports Monitor – Today Trading Day (28 March 2023)
Server Time / Timezone EEST (UTC+03:00)

- Midnight – Night Session (Asian)
No important figures/release > No major impact.
- Morning – Day Session (European)
At 11:45, the Bank of England Governor Andrew Bailey is speaking in London, along with Deputy Governor David Ramsden, about the collapse of Silicon Valley Bank before the Treasury Select Committee. GBP pairs might experience some intraday volatility again.
Later at 17:00, we have the release of the U.S. CB Consumer Confidence survey which asks respondents to rate the relative level of current and future economic conditions. It is a leading indicator of consumer spending. For this reason, an intraday shock is expected upon its release. The Index now stands at 102.9 (1985=100), down from 106.0 in January, and it is expected to decrease even more to 101.
General Verdict:
______________________________________________________________


