PREVIOUS TRADING DAY EVENTS – 18 April 2023
Announcements:
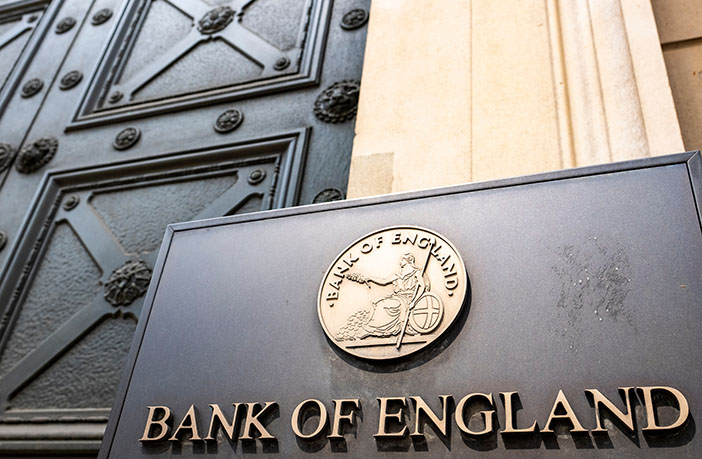
According to the Office for National Statistics (ONS), the unemployment rate edged up to 3.8% – its highest since the second quarter of 2022. There is now more than an 80% chance of the Bank of England (BoE) raising interest rates to 4.5% in May to help bring down inflation, which was above 10% in February.
Source: https://www.reuters.com/world/uk/uk-pay-growth-picks-up-three-months-february-2023-04-18/
A drop in energy prices had an impact on keeping the consumer price index low.
“While base effects helped to pull headline inflation sharply lower in March, there were also some encouraging signs in core inflation, as the average three-month annualised gain in CPI-trim and CPI-median fell to a 16-month low. We continue to expect headline inflation to fall faster than the Bank of Canada expects this year.” – Stephen Brown, senior Canadian economist, Capital Economics.
Source: https://www.reuters.com/world/americas/canada-annual-inflation-rate-slows-43-march-2023-04-18/
______________________________________________________________________
Summary Daily Moves – Winners vs Losers (18 April 2023)

______________________________________________________________________
News Reports Monitor – Previous Trading Day (18 April 2023)
Server Time / Timezone EEST (UTC+03:00)

- Midnight – Night Session (Asian)
No significant news announcements and no important scheduled releases.
- Morning – Day Session (European)
The U.K. Claimant Count Change, which measures the number of people claiming unemployment-related benefits during the previous month, was released at 9:00 along with the average earnings figure and unemployment rate. The latter was reported at 3.8%, causing a GBP appreciation and a short intraday shock for the GBP pairs.
Inflation-related figures for Canada were released at 15:30, causing intraday shocks to CAD pairs. The Consumer Price Index (CPI) rose by 4.3% year over year in March, following a 5.2% increase in February. These figures did not have much impact on CAD.
General Verdict:
______________________________________________________________________
FOREX MARKETS MONITOR
EURUSD (18.04.2023) Chart Summary
Server Time / Timezone EEST (UTC+03:00)
Price Movement
The pair started to move with high volatility after 8:00. During the European session, it was moving steadily higher and found resistance. Then, volatility settled and the pair was moving around the mean until the end of the trading day. No trading opportunities.

EURGBP (18.04.2023) Chart Summary
Server Time / Timezone EEST (UTC+03:00)
Price Movement
The EURGBP has been moving downwards with higher volatility than typical during the European Markets opening. At 9:00, the reported change in the number of people claiming unemployment benefits during the previous month was higher. EURGBP dropped at that time and soon retraced. It continued dropping during the day, moving below the MA but, around 17:00, the price reversed, crossing the MA and moving upwards.

____________________________________________________________________
EQUITY MARKETS MONITOR
US30 (Dow Jones) 4-Day Chart Summary
Server Time / Timezone EEST (UTC+03:00)
Price Movement
It is a quite volatile sideways path for U.S. blue-chip Stocks. Deviations from the mean reach over 200 USD. The index has shown strength in such volatile market conditions with great support levels keeping the sideways movement steady. Even the fears of recession and future high prices seem not to have a great impact. The Nasdaq and S&P indexes have similar charts, with 30-period MAs forming a slightly upward short-term direction.

______________________________________________________________________
COMMODITIES MARKETS MONITOR
USOIL (WTI) 4-Day Chart Summary
Server Time / Timezone EEST (UTC+03:00)
Price Movement
The price of Crude was declining at a steady pace over the last few days. It was moving downwards and below the 30-period MA after a reversal on the 13th of April. This was probably due to oversupply from Russia and steady demand along with the recent U.S. Dollar appreciation. On the 17th of April, it found resistance just a little below 80 USD.
Trading Opportunities
We see signals by the RSI starting from the 17th of April. Price: lower lows, RSI: Higher Lows, indicating bullish divergence, thus future higher price forecast.

XAUUSD (Gold) 4-Day Chart Summary
Server Time / Timezone EEST (UTC+03:00)
Price Movement
Gold moved with high volatility around the mean in the last few days. A reversal on the 14th of April brought the price down and under the 30-period MA, followed by another reversal on the 18th of April where it crossed the MA and moved upwards. It was mainly driven by the USD news and figure releases, causing the USD to appreciate. On the 14th, it was the Core Retail Sales figures, while on the 17th of April, it was the release of the Empire State Manufacturing Index.
Trading Opportunities
We see signals by the RSI starting from the 14th of April. Price: lower lows, RSI: Higher Lows, indicating bullish divergence, thus future higher price forecast.

______________________________________________________________
News Reports Monitor – Today Trading Day (19 April 2023)
Server Time / Timezone EEST (UTC+03:00)

- Midnight – Night Session (Asian)
No significant news announcements and no important scheduled releases.
- Morning – Day Session (European)
The U.K. CPI data was released early today, at 9:00. It was reported that the CPI change was 10.1% higher than expected but below the previous month’s figure. The GBP appreciated heavily.
CPI figures for Europe are being released at 12:00. They are not expected to have much impact on the EUR unless there are surprises.
General Verdict:
______________________________________________________________


