

PREVIOUS TRADING DAY EVENTS – 08 August 2023
Imports fell to the lowest level in more than 1-1/2 years. The decline in imports reported by the Commerce Department signals a slowdown in business investment and overall domestic demand amid hefty interest rate hikes from the Federal Reserve.
“Weakening consumer demand for goods and retreating inventory growth by businesses have softened imports this year, while exports continue to trend downward as the global economic backdrop softens,” said Matthew Martin, a U.S. economist at Oxford Economics. “We expect depressed trade flows through the remainder of the year.”
“The second quarter’s solid increase in real GDP might be revised lower in the next estimate,” said Bill Adams, chief economist at Comerica Bank in Dallas. “But the most timely and forward-looking economic indicators suggest the risk of a recession in the near future is receding.”
Source:https://www.reuters.com/markets/us/us-trade-deficit-narrows-june-imports-decline-2023-08-08/
______________________________________________________________________
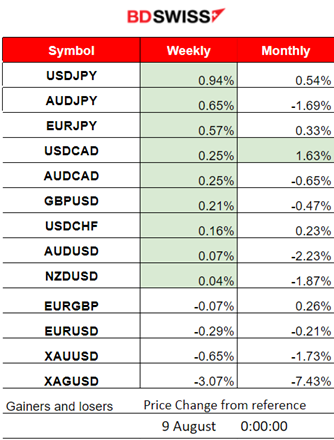
Winners vs Losers
______________________________________________________________________
News Reports Monitor – Previous Trading Day (08 August 2023)
Server Time / Timezone EEST (UTC+03:00)
- Midnight – Night Session (Asian)
No major news announcements and no major scheduled releases.
- Morning – Day Session (European)
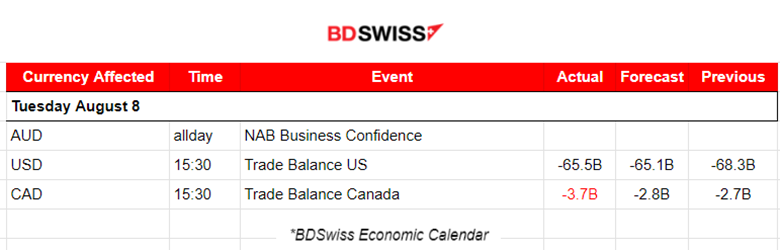
Trade Balance figures for the U.S. and Canada caused some more volatility than normal. No major impact on the pairs.
General Verdict:
____________________________________________________________________
FOREX MARKETS MONITOR
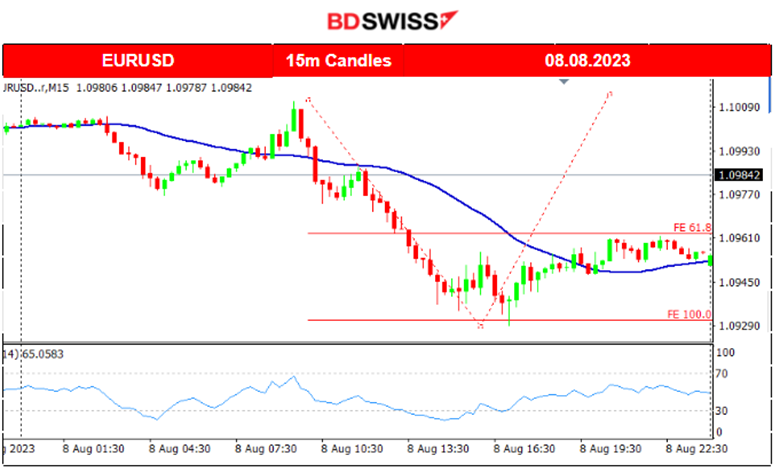
EURUSD (08.08.2023) Chart Summary
Server Time / Timezone EEST (UTC+03:00)
Price Movement
There was less volatility yesterday since there was an absence of important scheduled figures. However, the pair started to move downwards steadily and significantly until it found support around 15:30. The pair kept testing that until eventually, a retracement followed.
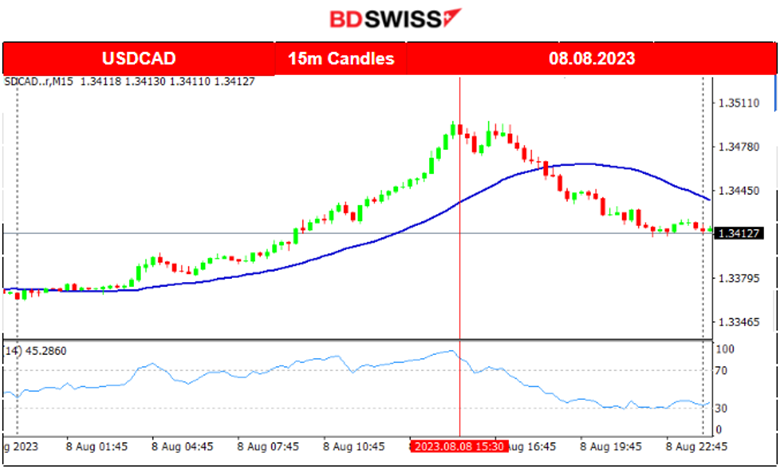
USDCAD (08.08.2023) Chart Summary
Server Time / Timezone EEST (UTC+03:00)
Price Movement
USDCAD was moving to the upside early, even from the start of the Asian session and found resistance at some point around 15:30 when the Trade Balance figure for Canada came out. No intraday shock was observed but only a retracement followed soon after.
___________________________________________________________________
EQUITY MARKETS MONITOR
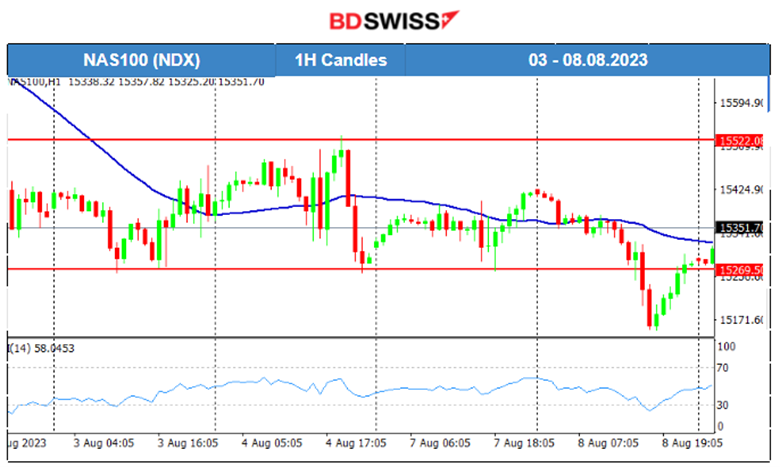
NAS100 (NDX) 4-Day Chart Summary
Server Time / Timezone EEST (UTC+03:00)
Price Movement
The U.S. stock market experienced high volatility recently but did not show any significant signal that the crash it experienced after the Fitch Ratings actually ended. A clear consolidation phase was taking place, as the NAS100 index seemed to be in range. It was, however, testing support levels, as depicted on the chart, near 15260. These eventually broke yesterday, triggering a downtrend signal. Will this be the start of a continuous fall in U.S. stock prices? The inflation rate figure will be released tomorrow.
_____________________________________________________________________
COMMODITIES MARKETS MONITOR
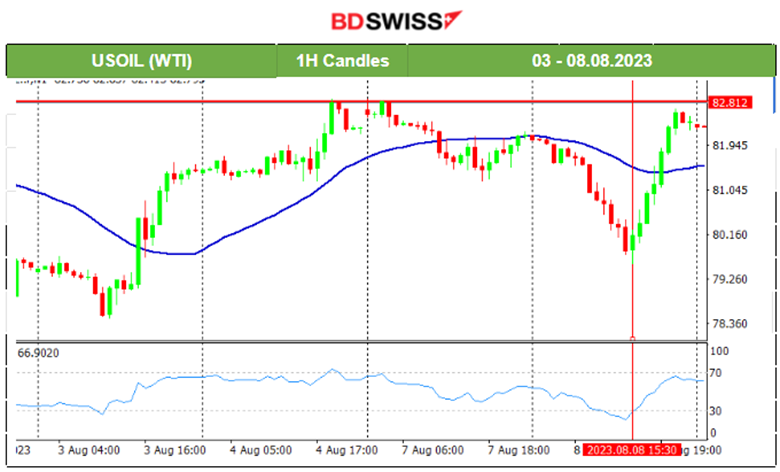
USOIL (WTI) 4-Day Chart Summary
Server Time / Timezone EEST (UTC+03:00)
Price Movement
The major reversal on the 3rd of August and the further climb to higher levels of the Crude price is explained by the recent production cuts announcements.
“The Joint Ministerial Monitoring Committee (JMMC) expressed its recognition and support for the efforts of the Kingdom of Saudi Arabia aimed at supporting the stability of the oil market and reiterated its appreciation for the Kingdom’s additional voluntary cut of 1 million barrels per day and for extending it for the month of September. The committee also acknowledged the Russian Federation for its additional voluntary reduction of exports by 300 kbd for the month of September.”
Source: https://www.opec.org/opec_web/en/press_room/7199.htm
Crude has reversed fully from the drop and tests 82.8 resistance.
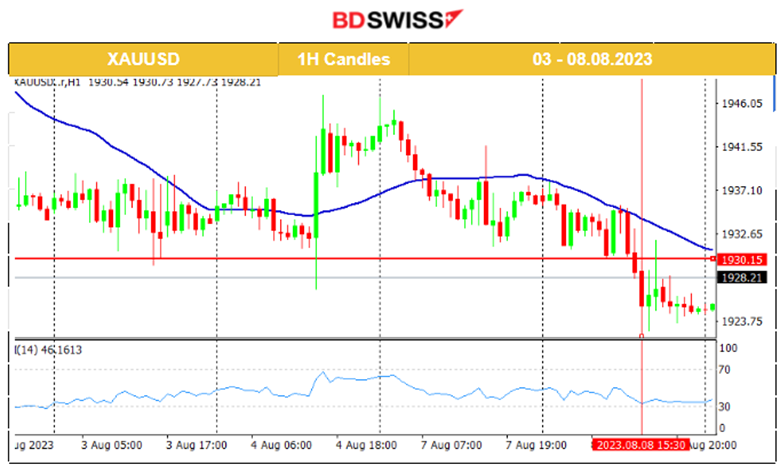
XAUUSD (Gold) 4-Day Chart Summary
Server Time / Timezone EEST (UTC+03:00)
Price Movement
On the 4th of August, Gold eventually broke the resistance upwards and reached even 1947 USD/z as the USD suffered strong depreciation with the NFP release. Gold now keeps its path above the support near 1930.10 USD/oz. Yesterday, those support levels broke and Gold moved downwards reaching the support of 1923 USD/oz.
As per the analysis on TradingView:
https://www.tradingview.com/chart/GOLD/QX2y0dl8-Gold-Support-Break-08-08-2023/
______________________________________________________________
News Reports Monitor – Today Trading Day (09 Aug 2023)
Server Time / Timezone EEST (UTC+03:00)
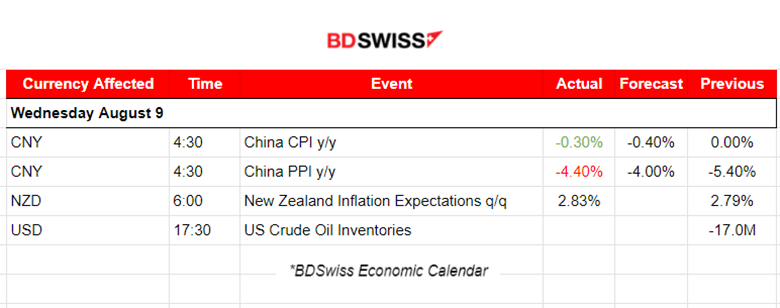
- Midnight – Night Session (Asian)
According to China’s CPI changes, China’s consumer prices dropped for the first time in over 2 years. We see a negative figure of -0.30%. No major shock was recorded for AUD pairs.
- Morning – Day Session (European)
No major scheduled releases except the U.S. Crude oil inventories figures. These are not expected to have a major impact on oil. The price lies now near 82.60 USD/b.
General Verdict:
______________________________________________________________


