Rates as of 04:00 GMT
Market Recap
It’s “risk on” in Asia this morning despite a slightly lower close on Wall Street yesterday. Most Asian stock markets are higher, although not stunningly so, while the S&P 500 was indicated up 1%. Markets were encouraged by news after the US close that Alphabet, the parent company of Google, beat revenue estimates. The company said that its internet search business stabilized in April after a sharp downturn at the end of March and has seen the first signs of a recovery, according to the FT.
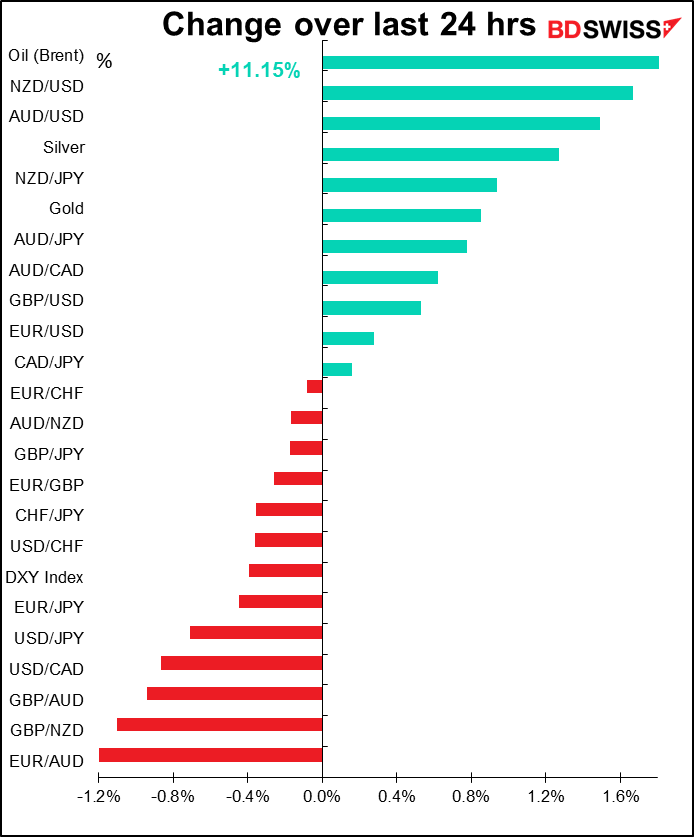
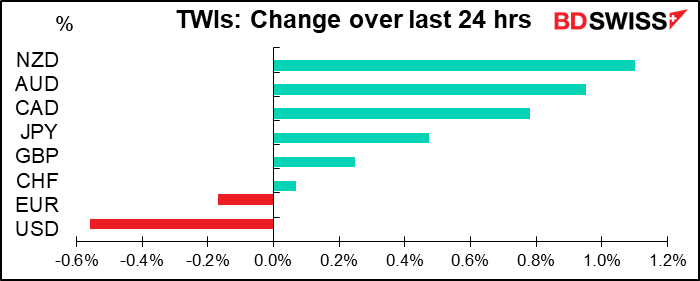
The FX market reflects this mood, with the commodity currencies gaining and the dollar losing.
NZD advanced the most, probably because the decline early yesterday was massively overdone, as I said. As the country lifted some of its restrictions today, PM Ardern said, “We can say with confidence that we do not have community transmission in New Zealand.” There were only two new cases a day for the last two days, and none the day before that. Australia also lifted some of its restrictions today. New cases there have been below 50 a day for more than two weeks.

AUD was the second-best performing currency. Bloomberg attributed the move to a higher-than-expected CPI print for Q1 (+2.2% yoy vs +1.9% expected, core measures also higher). However I don’t think this is correct, because a) most of the gains came before the figure was released, b) there was no visible fillip when the news came out, and c) in any case Reserve Bank of Australia (RBA) Gov. Lowe has already said he expects prices to go negative in Q2 and that they won’t lift rates until they are making “sustainable progress” toward their inflation and employment goals.
On the other hand, USD was the big loser ahead of today’s Federal Open Market Committee (FOMC) meeting, which is likely to reaffirm the Fed’s dovish stance (see below). It’s noticeable that the dollar declined vs both AUD and JPY.
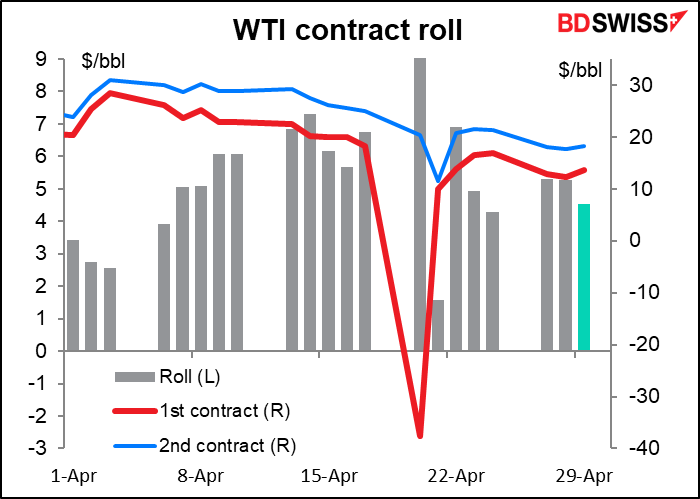
Oil had a great day, with the WTI contract up $2.93 or 26.5% and Brent up $2.13 or 11.2%. Still, with WTI trading at around $14/bbl it’s hardly a bull market in crude. There’s no change in the fundamental picture; the American Petroleum Institute (API) reported yesterday that crude oil inventories rose around 10mn barrels in the latest week, with stocks at the delivery terminal in Cushing, Oklahoma up 2.49mn. All that happened is the big rush to roll from the June contract into July finished and so the pressure on June receded a bit, reducing the cost of rolling from June into July.
Another central bank cuts rates: Following the currents of monetary policy worldwide, the Bank of Nook cut its deposit rate to nearly zero – 0.05% — from an already-low 0.5%. The Bank of Nook is the central bank in Nintendo’s online fantasy game Animal Crossing: New Horizons. Apparently the move had nothing to do with a slumping economy in the game, which is doing quite well, but rather an attempt to prevent people from defrauding the bank by depositing money and then adjusting their game console’s internal clock to make it appear the money had been on deposit for decades. The BoN move is similar to what the Bank of England did back in the 1980s, when it found that “round-tripping” of deposits (borrowing from the central bank and depositing them in the money market) was accelerating the increase in money supply that high interest rates were designed to dampen. (From today’s FT.)
Today’s market
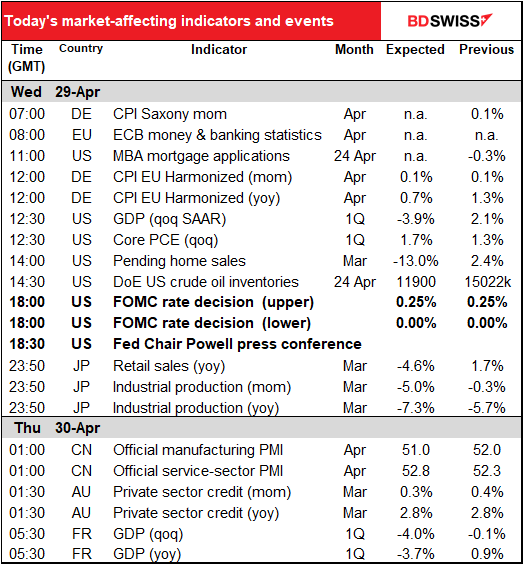
Lots on the schedule today!
The big event of the day is of course the meeting of the US Federal Reserve’s rate-setting body, the Federal Open Market Committee (FOMC).
You can read my whole take on the Fed in my weekly column, Main Street vs Wall Street. I’ll just summarize that piece here.
The Fed’s asset purchases so far have been aimed at managing the Treasury market. Now the authorities are likely to turn their attention towards easing financial conditions, which have tightened recently, and increasing the degree of policy accommodation.

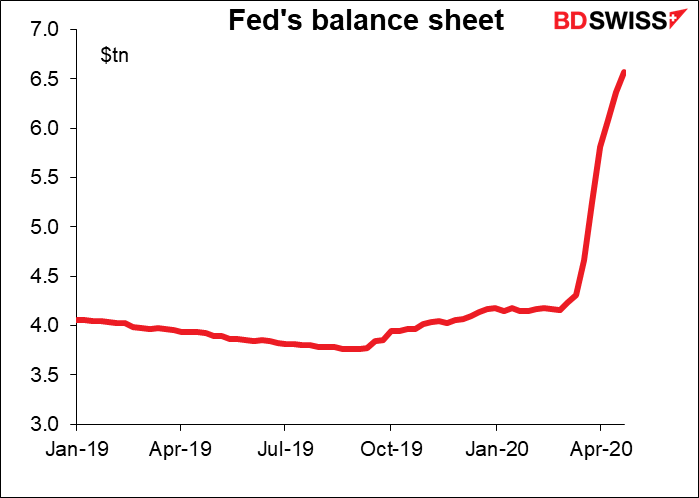
As a result, I would expect them to continue to increase the size of their balance sheet, currently some $6.6tn (of which $2.4tn or over one-third has been added just since the beginning of March). Estimates are that it will have to add another $4tn to that during the year. One idea is for it to replace its weekly purchasing target of $75bn/week with a monthly program of perhaps $150bn a month, perhaps targeting longer-duration bonds.
The Fed’s latest forward guidance is relatively vague, as befits a situation where no one knows what’s likely to happen. The Committee “expects to maintain this target range until it is confident that the economy has weathered recent events and is on track to achieve its maximum employment and price stability goals.” With the situation still so uncertain, I suspect that they’ll keep this vague language.
FX market implications: The tsunami of liquidity that the Fed has flooded the market with, both with its domestic operations and currency swaps with foreign central banks, has been aimed in part at satisfying the very real need for dollars among borrowers both at home and abroad. The fact that the currency swap basis in several currencies has turned positive recently indicates that they have succeeded in satisfying this sudden rush for dollars overseas. If the market perceives that the Fed is going to continue to stuff it with dollars even after borrowers have apparently covered their positions for now, then the dollar could turn into the WTI of the FX market: the price might fall as supply continues to overwhelm demand. That depends on how much the Fed promises to supply and just how serious it sounds about wanting to ease financial conditions further. For the latter we have to wait for Chair Powell’s press conference to see how strongly he emphasizes the Fed’s willingness to act quickly and aggressively if necessary. I expect he will radiate confidence and that the dollar will weaken afterward.
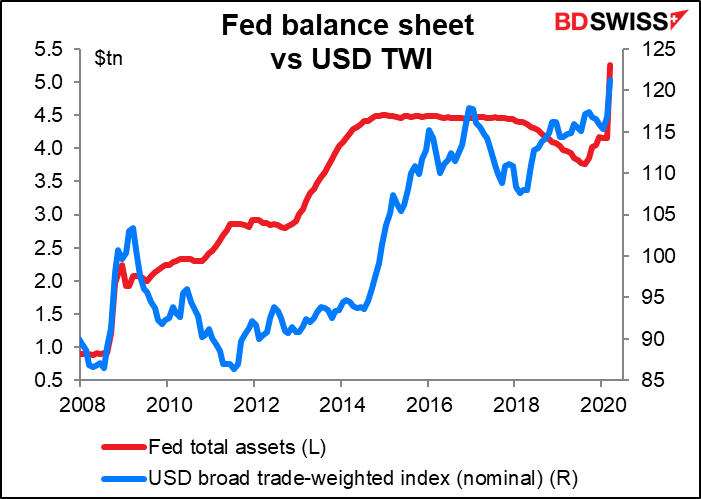
Longer term though, I’m not sure this is an obstacle to USD strength. The size of the Fed’s balance sheet has increased more than 5x since before the Global Financial Crisis, and it hasn’t prevented the dollar from strengthening further. Much depends on what mistakes other countries make, too.
Today’s indicators
Today we get German inflation, an important precursor to tomorrow’s EU inflation figures. No one cares about inflation at the moment though, because that’s not the biggest worry on central bankers’ minds – the collapse of civilization is. German headline inflation (EU harmonized) is forecast to plunge to 0.5% yoy – similar to the plunge forecast for tomorrow’s EU-wide CPI down to a mere +0.1% yoy! Nearly at deflation! This is due largely (but not entirely) to falling oil prices; EU-wide core inflation is forecast to fall to +0.7% yoy from +1.0%, which is still a drop but less of one. The ECB targets core inflation. Nevertheless, I think everyone realizes that inflation is going to be lower in a period of no demand and so numbers like this won’t elicit an immediate reaction by either central bankers nor therefore market participants.

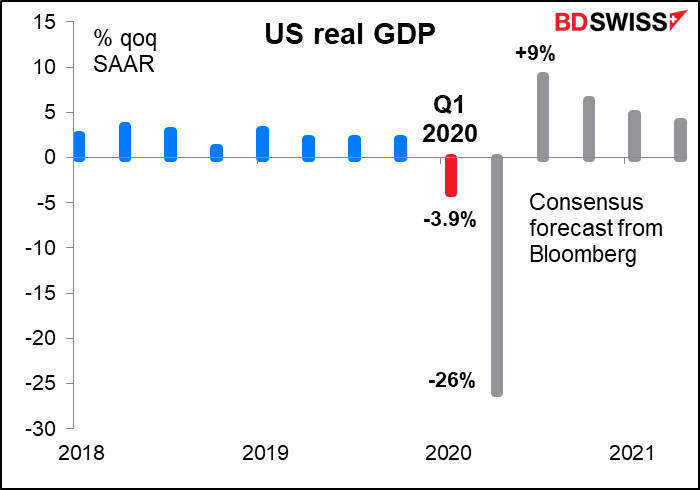
US Q1 GDP is expected to be really bad, but not as bad as Q2 – that’s expected to be the worst on record. Aren’t you excited to be able to see all these new records being made? Years from now, when your children are starting to invest and they say to you “wow, you should’ve seen the GDP figures today!” you can say, “Kid, when I was your age…”
Forecasts are all over the place, in recognition of just how uncertain activity in the second half of March was. On Bloomberg, they range from -10% to -1%, with a standard deviation (a measure of variance) of 2.04%. By comparison, for the initial release of the Q4 2019 GDP it was 0.32%.
The Atlanta Fed’s GDPNow forecast is -1.0%. The NY Fed Staff Nowcast is -0.4%. And the St. Louis Fed’s Real GDP Nowcast is an astonishing -15.3. How people can take the same data and come up with such different answers demonstrates why economists often don’t agree on what the best policy path is.
The quarterly core personal consumption expenditure (PCE) deflator, the Fed’s preferred inflation gauge, is released as part of the GDP data. It’s expected to bounce up a bit closer to the Fed’s 2% target. Normally that would be a bullish USD sign because it would suggest the Fed is likely to turn to a neutral stance in the near future. Hah! Not now.

US pending home sales are yet another graph for which I have to readjust the axis to take into account a number I’ve never seen before. The forecast of -13% wouldn’t be a record low, however. Pending home sales jumped a record 11.2% in April 2010, the last month that a tax credit for buyers was available. The following month they fell a record 30.4% (data only goes back to 2001). There’ve been several other months with double-digit declines, just not recently.

US crude oil inventories are expected to show yet another rise. No surprise there. The pace of increase does seem to be slowing however, probably because the number of oil and gas rigs in operation in the country has fallen by 41% over the last six weeks (according to the Baker Hughes data on this subject that’s released every Friday). Obviously though this is only enough to slow the increase in inventories, not reverse it.

Meanwhile, at the other end of the production chain, oil product inventories of 1.367bn barrels are nearing their record high of 1.374bn.

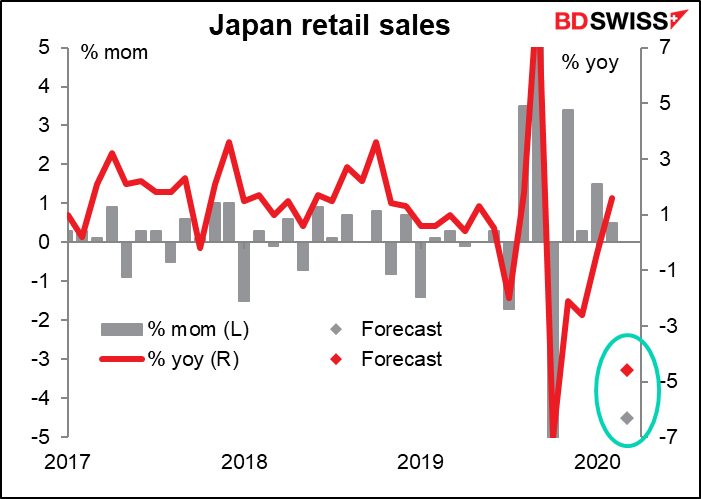
Overnight we get some of the usual end-of-month statistics from Japan. I don’t usually cover Japanese retail sales, but we’re all interested in tracking the zombification of the global economy now. Japan’s retail sales data is not that good – it doesn’t take in a lot of the market, such as internet sales. Nonetheless it’s all we have. The drop is expected to be comparable to those following a hike in the consumption tax.
Japan’s industrial production isn’t expected to be much better.

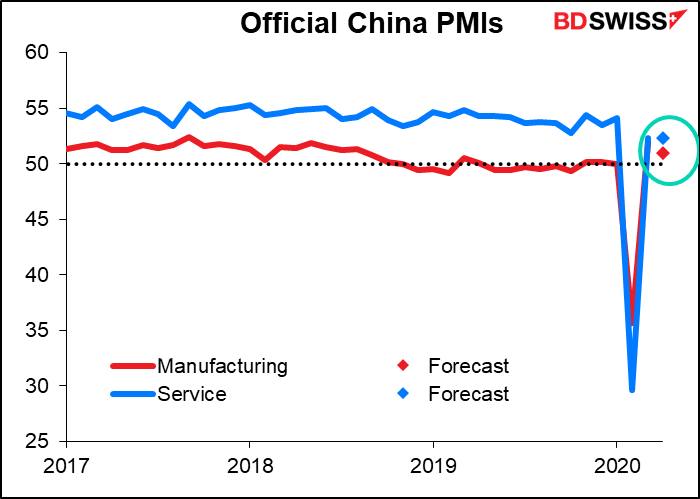
China’s official purchasing managers’ indices (PMIs) will be eagerly awaited to see just how the Middle Kingdom is bouncing back after the COVID-19. The PMIs plunged in February, but both bounced back above the 50 “boom or bust” line in March. That’s easy to understand: the PMI measures whether things are getting better or worse, not whether they are good or bad. We can assume that “terrible” is an improvement from “horrible.” Therefore March was probably better than February, when a good portion of the country was under lockdown, and April will probably be even better than March. The service-sector PMI is expected to be unchanged while the manufacturing PMI is forecast to slip a little, but remain above 50.
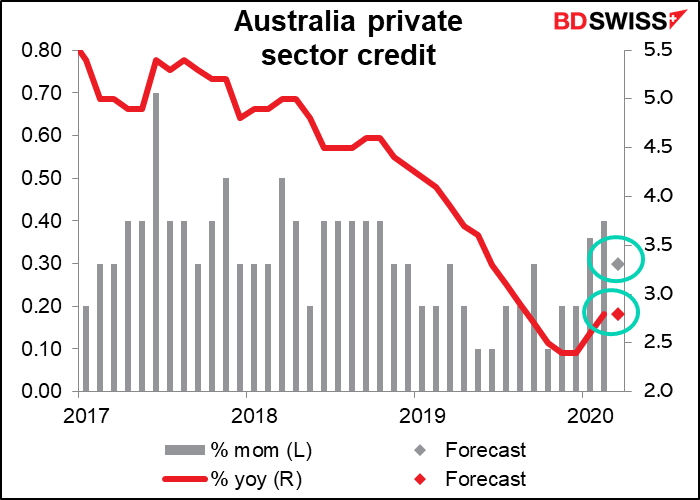
Australia’s private sector credit growth is forecast to have been steady in March as housing was doing OK before the virus came in and wrecked everything. I wouldn’t bet on the trend being continued in April however.