Previous Trading Day’s Events (17.05.2024)
______________________________________________________________________
Winners vs Losers
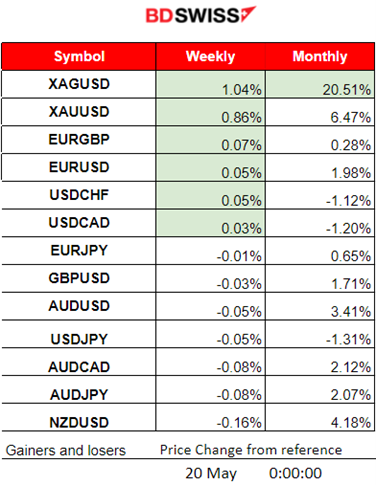
Silver is on the top for this week with already 1% gains and a total of 20.51% gains for the month. Gold follows with 6.47% gains this month so far.
 ______________________________________________________________________
News Reports Monitor – Previous Trading Day (17.05.2024)
Server Time / Timezone EEST (UTC+03:00)
- Midnight – Night Session (Asian)
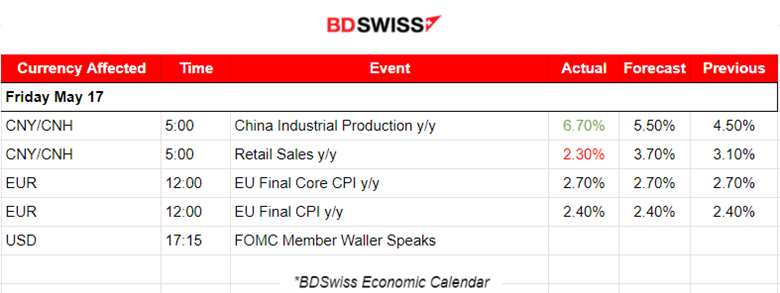
China experiences slower growth on the consumer side while industrial activity remains robust. Retail sales rose by 2.3% in April compared to last year, less than the 3.8% increase forecast by a Reuters poll, and slower than the 3.1% pace reported in March. Industrial production rose by 6.7% in April from a year ago, beating expectations for 5.5% growth. AUD and CNH saw moderate depreciation after the news. AUDUSD dropped near 10 pips.
- Morning – Day Session (European and N. American Session)
The annual inflation rate in the Euro area was 2.4% in April 2024, stable compared to March 2024. A year earlier, the rate was 7.0%. In the EU, the annual inflation was 2.6% in April 2024, stable compared to March 2024. A year earlier, the rate was 8.1%. No market impact from the news. There are 2 versions of this report released about two weeks apart – Flash and Final. The Flash release, which the source first reported in April 2013, is the earliest and thus tends to have the most impact.
General Verdict:
 __________________________________________________________________
FOREX MARKETS MONITOR
EURUSD (17.05.2024) 15m Chart Summary
Server Time / Timezone EEST (UTC+03:00)
Price Movement
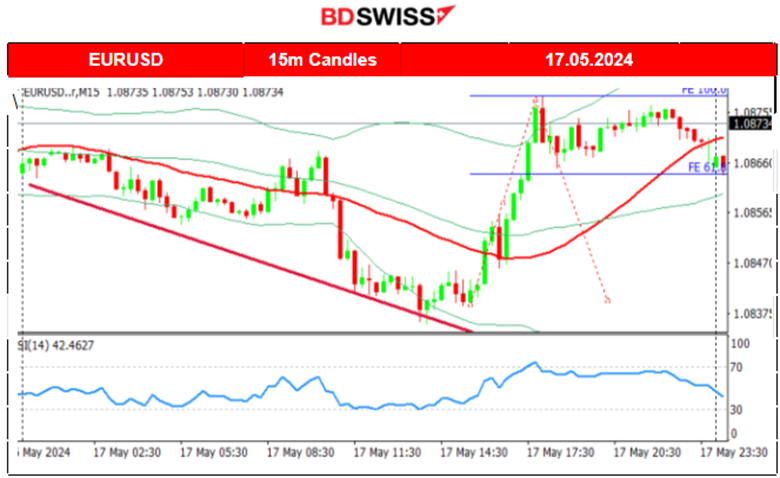
The pair moved early to the downside because the U.S. dollar started to appreciate early and with a quite volatile path. A reversal followed after the dollar suddenly weakened causing the pair to climb rapidly and cross the MA on its way up until it found the resistance at 1.08790. Retracement followed the 61.8 Fibo level as depicted on the chart.
 ___________________________________________________________________
CRYPTO MARKETS MONITOR
BTCUSD (Bitcoin) Chart Summary 1H
Server Time / Timezone EEST (UTC+03:00)
Price Movement
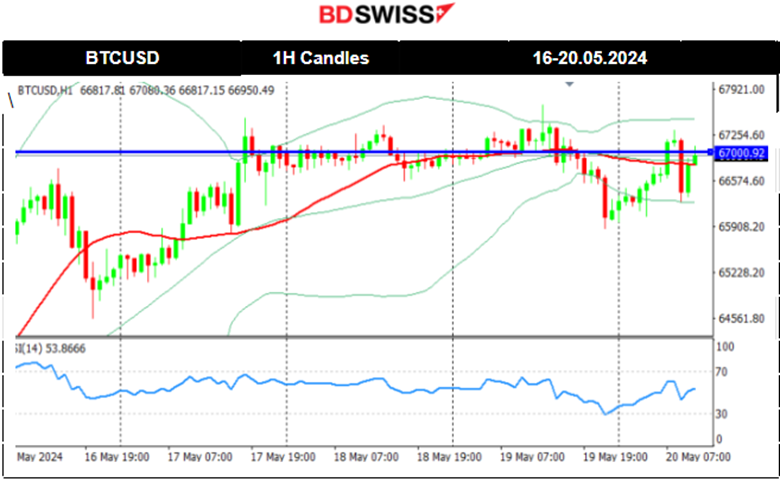
Bitcoin enthusiasts are now gaining confidence that Bitcoin is returning to the upside. The CPI news obviously triggered the jump. As mentioned in our analysis last time, retracement followed eventually with Bitcoin returning to the 61.8 Fibo level before again moving upwards.
On the 17th of May, the price moved upwards eventually, crossing over the 67K USD level but remained close. Since that day a consolidation phase took place with the 30-period MA to turn sideways and the mean to remain at 67K USD. The price tested that resistance many times without success. It might do that this week with Bitcoin potentially reaching the next resistance at near 70K USD.
 Crypto sorted by Highest Market Cap:
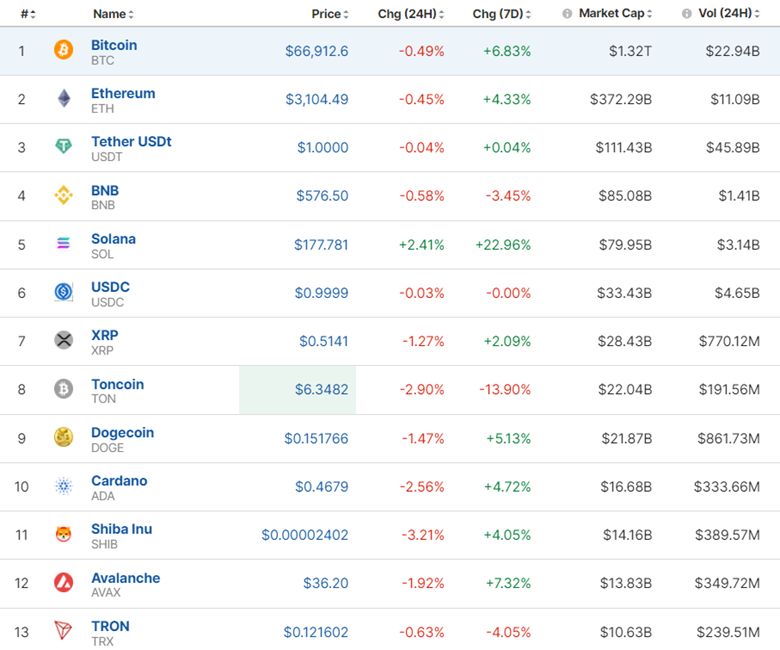
After the U.S. CPI report showed a slowdown in inflation, the Crypto market saw a boost. The 7-day period shows mixed data but most Crypto have gains with Solana leading.
Source: https://www.investing.com/crypto/currencies
______________________________________________________________________
EQUITY MARKETS MONITOR
S&P500 (SPX500) 4-Day Chart Summary
Server Time / Timezone EEST (UTC+03:00)
Price Movement
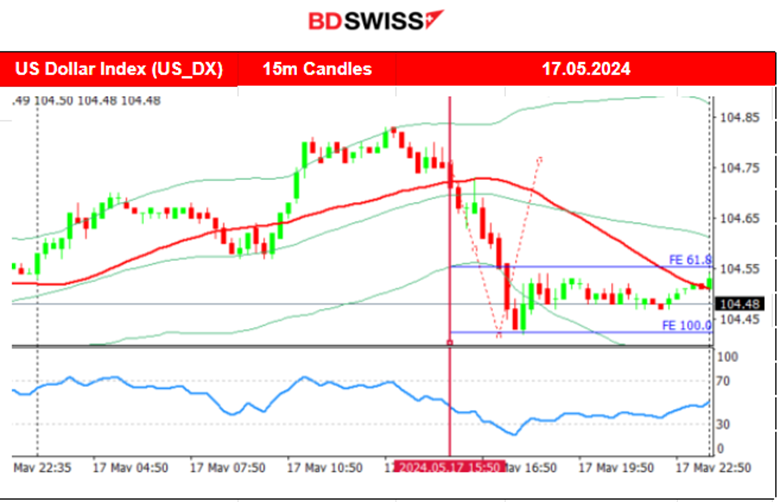
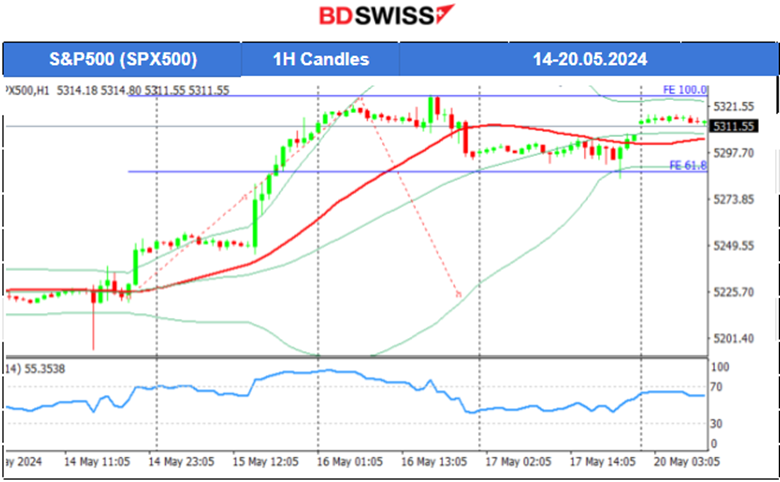
The PPI news on the 14th of May caused a breakout of the support near 5,211 USD causing the index to drop to 5,195 USD before it reversed immediately to the upside. This happened due to the dollar effect, we saw that the dollar index reversed immediately as well to the downside at that time. The level 5,240 USD was quite significant for resistance and that was broken on the 14th of May after the index’s continuation to the upside. The other indices experienced similar paths. On the 15th of May, the U.S. CPI report caused dollar depreciation and a jump in U.S. stocks. On the 16th of May, the index moved upwards again until it found strong resistance that marked the reversal to the downside. Dollar strengthening and not-so-interesting unemployment claims figures pushed the index to cross the 30-period MA and to settle at the 61.8 Fibo level. On the 17th of May, the index moved with low volatility on the sideways and around the MA with a mean at 5,300 USD.
 ______________________________________________________________________
COMMODITIES MARKETS MONITOR
USOIL (WTI) 4-Day Chart Summary
Server Time / Timezone EEST (UTC+03:00)
Price Movement
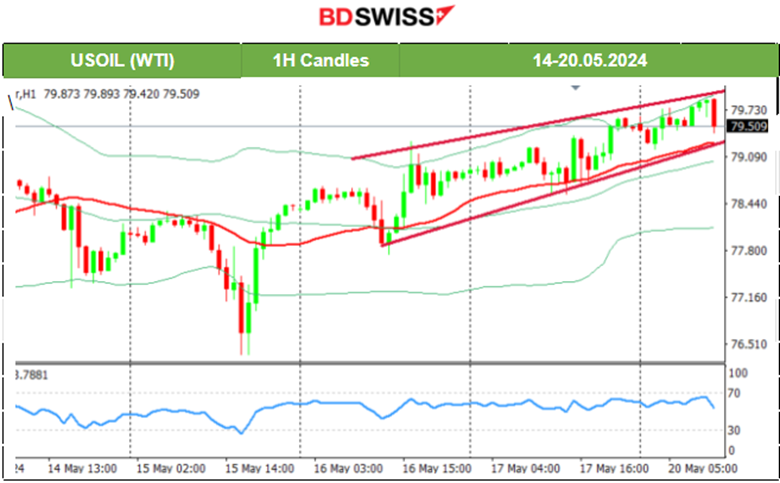
On the 14th of May, the PPI news caused its price to drop and test again the support at near 77.40 USD/b before it eventually retraced to the 30-period MA. On the 15th of May Crude oil broke the support at near 77.40 USD/b and moved lower near the support at 76.40 USD/b before it reversed to the upside. During the U.S. CPI news volatility levels grew with Crude oil to experience first a fall and then a full reversal. It crossed the 30-period MA moving rapidly to the resistance near 78.78 USD/b and a retracement took place as predicted in our previous analysis back to the 61.8 Fibo. After the news on the 16th of May, Crude oil started a steady path to the upside remaining above the MA. This path looks like an upward wedge, if not a channel, that the price now follows as it moves to the upside and a potential opportunity to trade upon breakout.
 XAUUSD (Gold) 4-Day Chart Summary
Server Time / Timezone EEST (UTC+03:00)
Price Movement
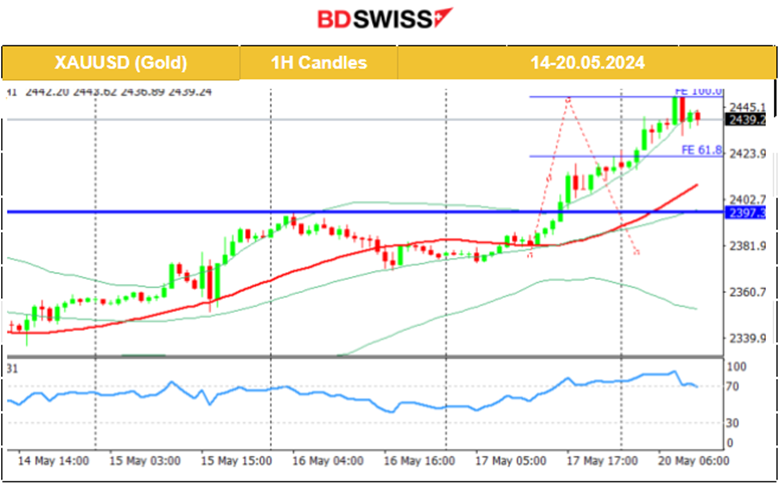
On the 14th of May, the support held and the price reversed to the upside correcting from the drop. Gold crossed the MA on its way up and moved higher to the resistance at 2,360 USD/oz. The dollar weakening helped gold to stay higher. After the release of the U.S. CPI news on the 15th of May, Gold jumped higher following the USD’s depreciation, reaching the resistance at near 2,397 USD/oz. Retracement followed as mentioned in our previous analysis, reaching 2,372 USD/oz.
The unemployment claims figures did not have much impact on the 16th of May. USD strengthening caused this drop in the price of Gold. After the retracement, it remained stable and close to the MA.
On the 17th of May, Gold moved to the upside after gaining strong momentum confirming the continuation of an uptrend. Iran’s hardliner President Ebrahim Raisi was killed in a helicopter crash, the country’s state media has said. On Monday, the Iranian Red Crescent confirmed the bodies of the president and others who died in the crash had some bullish impact on Gold. The demand for bullion assets was further bolstered by heightened military action between Russia and Ukraine. Both nations launched strikes against one another over the weekend. The fundamentals continue to point to a bullish trend for the near future.
 ______________________________________________________________
News Reports Monitor – Today Trading Day (18 April 2024)
Server Time / Timezone EEST (UTC+03:00)
- Midnight – Night Session (Asian)
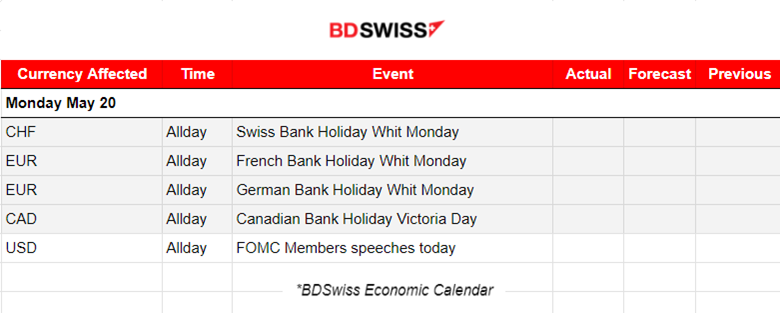
No major news announcements, no major figure releases.
- Morning – Day Session (European and N. American Session)
No major news announcements, no major figure releases.
Geopolitical and social events: Iran’s hardliner President Ebrahim Raisi was killed in a helicopter crash as mentioned already.
General Verdict:
______________________________________________________________


