Previous Trading Day’s Events (09 Feb 2024)
“The job market still seems resilient,” said Derek Holt, vice president of capital markets economics at Scotiabank. “We saw wage growth cool in the latest month, but overall the trend is relatively hot.”
The Bank of Canada (BoC) has kept its key overnight interest rate at a 22-year high of 5% since July, as it strives to bring inflation back to its 2% target. Inflation was 3.4% in December.
“Today’s data suggest that the Bank (of Canada) won’t be in a rush to cut interest rates, and we maintain our expectation for a first move in June,” said Andrew Grantham, an economist at CIBC Capital Markets.
Source: https://www.reuters.com/world/americas/canada-adds-37300-jobs-january-wage-growth-slows-2024-02-09/
______________________________________________________________________
Winners vs Losers
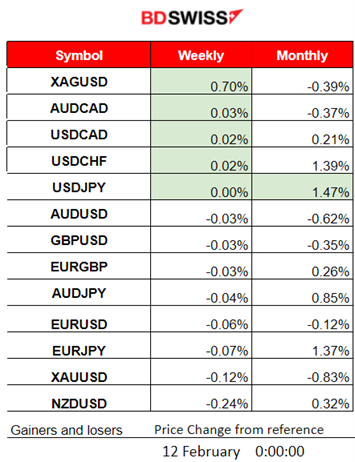
Silver is on the top of the winner’s list with 0.70% gains for the week while USDJPY leads this month with 1.47% gains. At the beginning of February, the dollar jumped and remained strong, however, it is currently showing weakness as days pass.
______________________________________________________________________
News Reports Monitor – Previous Trading Day (09 Feb 2024)
Server Time / Timezone EEST (UTC+02:00)
- Midnight – Night Session (Asian)
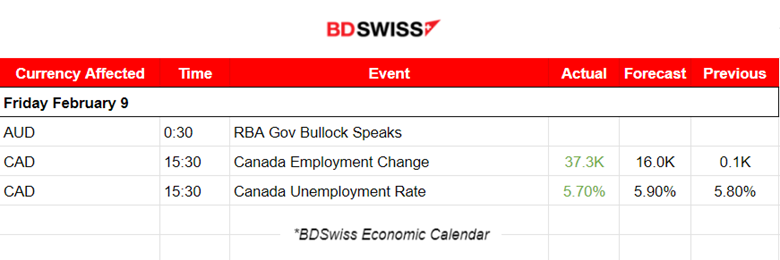
RBA: “Rate cuts possible even if inflation outside 2-3% target band” as stated by the RBA Governor Michele Bullock before the House of Representatives Standing Committee on Economics, in Canberra. Probably justifiable considering that: unemployment is high at 3.9% and the latest employment change data showed a huge decline. Inflation dropped from Oct 2023, 5.4% to 3.4%. It would be a challenge for every central bank this year to keep the balance between fighting inflation and causing less damage to the economy.
No major market reaction was recorded at the time of the event.
- Morning–Day Session (European and N. American Session)
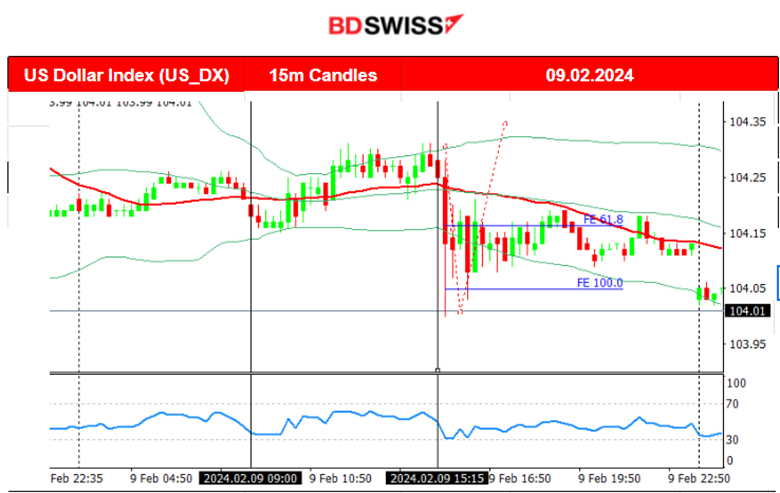
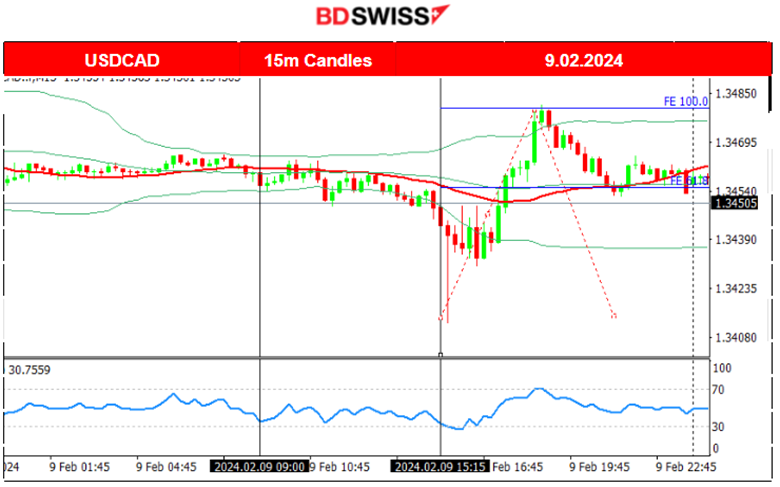
Canada’s labour data was reported at 15:30 and shook the market as it showed quite strong labour market indications. The employment growth for January 2024 was reported to be way higher than expected, 37.3K versus the expected 16K, while unemployment lowered to 5.7%. The market reacted with CAD appreciation and USD depreciation at first, but readjusted their positions soon after, the USD in particular, with the USD gaining back some strength eventually. The USDCAD dropped near 30 pips, before immediately reversing fully from the downside drop and very soon after went back to the intraday MA.
General Verdict:
____________________________________________________________________
FOREX MARKETS MONITOR
EURUSD (09.02.2024) 15m Chart Summary
Server Time / Timezone EEST (UTC+02:00)
Price Movement
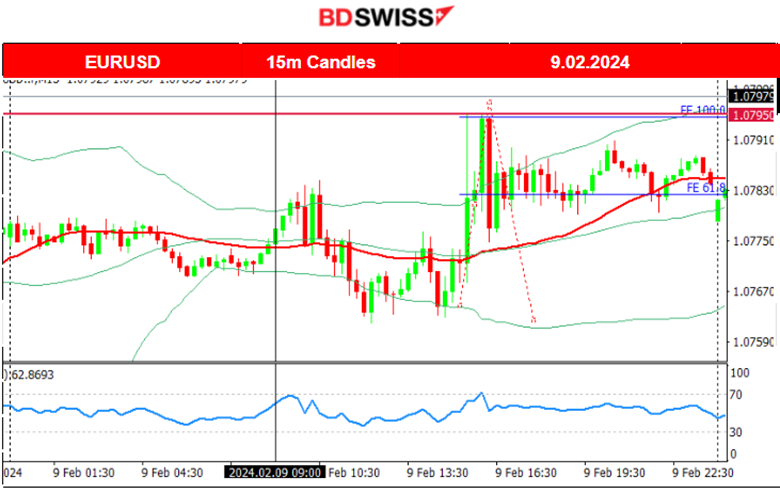
The pair was moving sideways around the mean with low volatility. That changed after the start of the European session with the pair experiencing higher deviations from the 30-period MA on its sideways path. After the release of Canada’s employment data at 15:30 the USD depreciated heavily against other currencies at first, including the EUR and the CAD. The EURUSD moved to the upside during that time, finding resistance at 1.07950 before retracing to the mean eventually and at the 61.8 Fibo level.
USDCAD (09.02.2024) 15m Chart Summary
Server Time / Timezone EEST (UTC+02:00)
Price Movement
The pair started moving with higher volatility after the start of the European Session, moving towards the downside steadily. At 15:30, at the time of the release of the Labor data for Canada, an intraday shock occurred, causing the CAD to appreciate but only momentarily. The pair dropped instantly at that time and reversed immediately to the upside, back to the 30-period MA. The upward movement continued at a fast pace until the pair found resistance at near 1.34800. Retracement followed and the pair returned to the 61.8 Fibo level and the intraday mean.
__________________________________________________________________
CRYPTO MARKETS MONITOR
BTCUSD (Bitcoin) Chart Summary
Server Time / Timezone EEST (UTC+02:00)
Price Movement
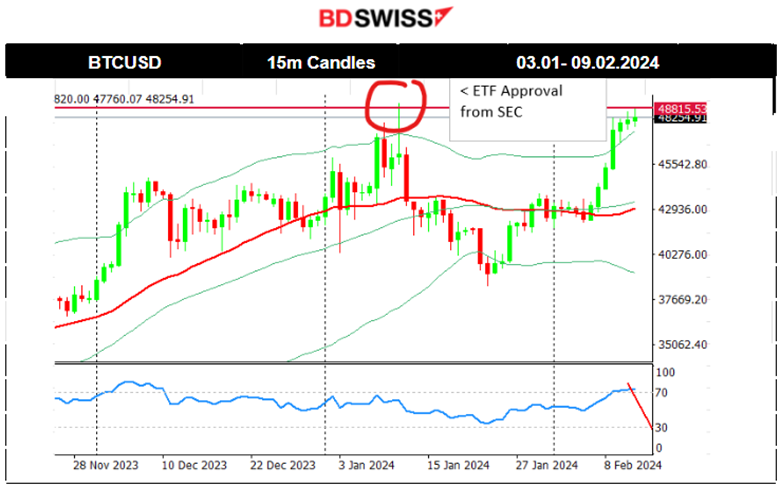
On the 7th Feb, Bitcoin moved to the upside aggressively. The momentum is quite strong as it seems to break all the Fibo levels, 100 and 161.8 without any significant retracement. Its price continued to the upside aggressively breaking further resistance and eventually reaching the strong resistance at near 48,900 USD, levels last seen during the SEC news regarding the approval of Bitcoin ETFs. Currently, the RSI14 (H1 time frame) shows quite bearish signals for now (lower highs).
Crypto sorted by Highest Market Cap:
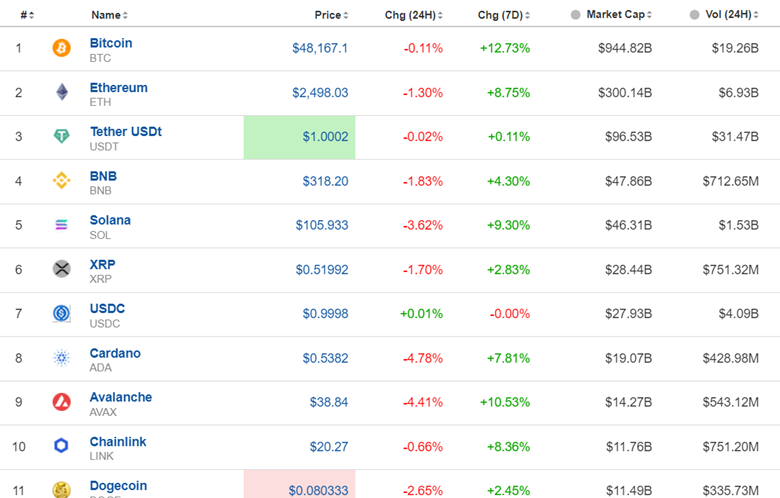
Strong gains for Cryptos as the market corrects from the recent unusual drop after the regulator’s spot Bitcoin ETF approvals. 12.73% gain for Bitcoin in the last 7 days.
Source: https://www.investing.com/crypto/currencies
______________________________________________________________________
EQUITY MARKETS MONITOR
NAS100 (NDX) 4-Day Chart Summary
Server Time / Timezone EEST (UTC+02:00)
Price Movement
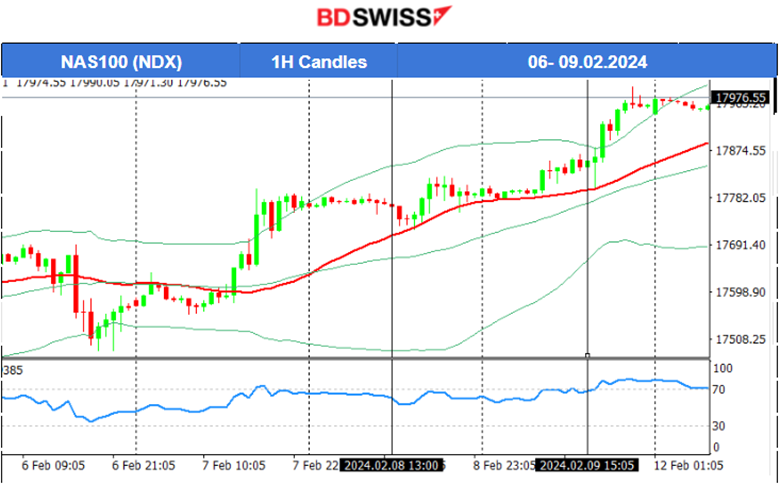
On the 6th Feb, the index did not manage to break the resistance at near 17,700 USD and a reversal again followed back to the support at near 17,500 USD. Another reversal sent the index back to the mean. A clear consolidation phase kept the index on the sideways, however experiencing high volatility on the way. On the 7th Feb, the index moved higher breaking the triangle as depicted on the chart and settling near 17,790 USD. On the 8th Feb, the index did not experience strong volatility closing the trading day almost flat, however, on the 9th Feb, it moved to the upside aggressively reaching the area near the 18,000 level. The RSI does not show any signal of the index reversing soon.
______________________________________________________________________
COMMODITIES MARKETS MONITOR
USOIL (WTI) 4-Day Chart Summary
Server Time / Timezone EEST (UTC+02:00)
Price Movement
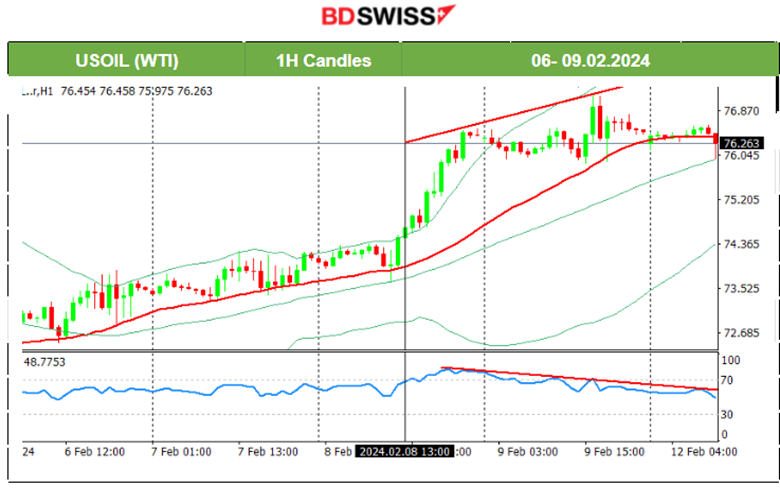
Crude’s price reversed from the downtrend following the RSI’s signals of bullish divergence, as mentioned in the previous analysis. After it reached 74.5 USD/b on the 5th Feb, it reversed to the upside, crossing the 30-period MA on the way up and finding resistance at near 73.2 USD/b before retracing. On the 6th Feb, the price moved steadily upwards while being above the 30-period MA. The same happened on the 7th Feb. Surprisingly, crude oil moved significantly higher on the 8th Feb after it broke the apparent channel, as depicted on the chart, reaching the resistance near 76.5 UD/b. On the 9th Feb, the price remained on the same level after a quite volatile trading day. The RSI shows a bearish divergence, indicating that Crude might move significantly lower this week.
XAUUSD (Gold) 4-Day Chart Summary
Server Time / Timezone EEST (UTC+02:00)
Price Movement
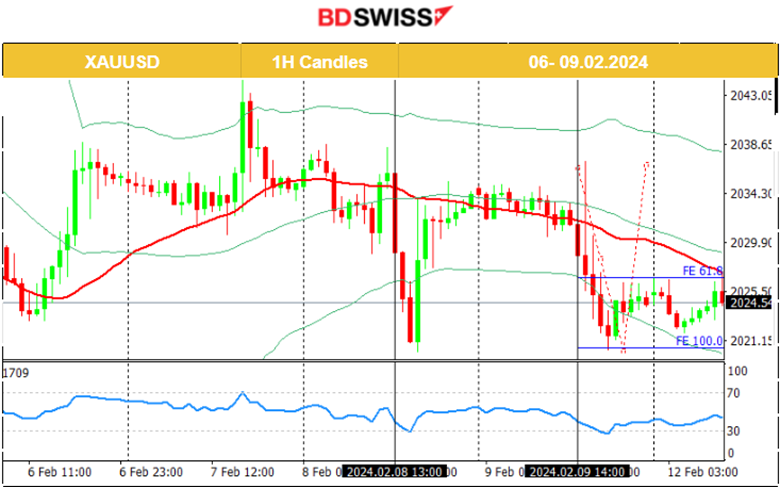
On the 8th Feb, Gold broke the upward channel moving to the downside and reaching the support 2020 USD/oz after the USD experienced strong early appreciation. It closed the trading day almost flat since the USD lost strength significantly causing Gold’s price to reverse fully. On the 9th Feb, it experienced another drop testing again that support at near 2020 USD/oz. After an unsuccessful breakout, it eventually retraced to the Fibo 61.8 level.
______________________________________________________________
News Reports Monitor – Today Trading Day (12 Feb 2024)
Server Time / Timezone EEST (UTC+02:00)
- Midnight – Night Session (Asian)
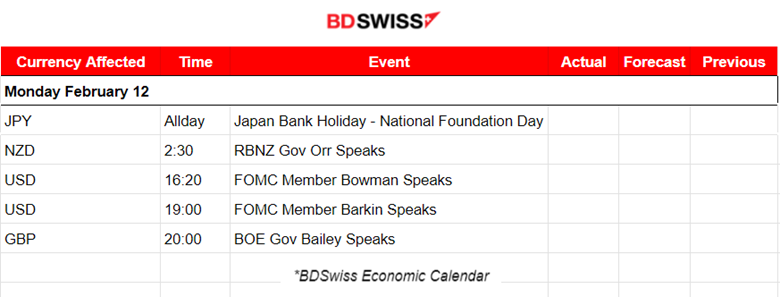
The Reserve Bank of Australia governor’s speech took place after 2:30, related to the November Financial Stability Report, speaking before the Finance and Expenditure Committee, in Wellington. The market experienced volatility and the NZD started to depreciate significantly. Major Impact statement: “Inflation remains elevated, leading to the maintenance of the 5.5% cash rate”. The NZD/USD edged lower despite the hawkish remarks.
- Morning–Day Session (European and N. American Session)
Several speeches from FOMC members during the N. American session could increase volatility levels. No intraday shocks are expected.
General Verdict:
______________________________________________________________


