

Previous Trading Day’s Events (21.05.2024)
Month on month, the consumer price index rose 0.5% in April, also less than a forecast of a 0.6% gain.
“Canadian central bankers should have the evidence they need to begin easing monetary policy,” Royce Mendes, head of macro strategy for Desjardins Group, wrote in a note, adding that he was expecting the first rate cut to happen in June.
“There is no longer any question about the trajectory, and the Bank of Canada is out of excuses to dither and wait for further confirmation to cut at the June meeting,” said Kyle Chapman, FX Markets Analyst at Ballinger Group.
The cooling was moderated by gasoline prices; excluding them, annual inflation slowed to 2.5% from 2.8% in March.
______________________________________________________________________
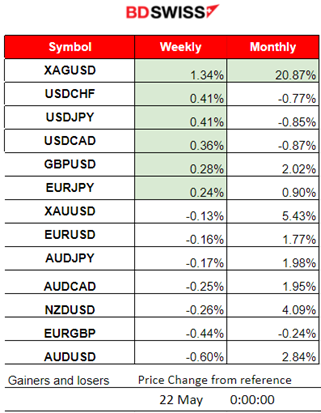
Winners vs Losers
Silver (XAGUSD) returns to the top of the week’s winner list with 1.34% and increases the monthly performance to 20.87%. Dollar pairs reached the top (Base currency) as the dollar remains stable with a potential of gaining more strength.
 ______________________________________________________________________
News Reports Monitor – Previous Trading Day (21.05.2024)
Server Time / Timezone EEST (UTC+03:00)

- Midnight – Night Session (Asian)
Minutes of the May 2024 Reserve Bank of Australia (RBA) meeting were released at 4:30. The Board agreed it was difficult to either rule in or rule out future changes in the cash rate. The flow of data had increased risks of inflation staying above target for longer and they expressed their limited tolerance for inflation returning to target later than 2026. The market reacted with an AUD depreciation at that time. AUDUSD dropped near 25 pips before retracing to the intraday MA.
- Morning – Day Session (European and N. American Session)
At 15:30 the CPI data for Canada showed that inflation lowered significantly causing CAD depreciation and a jump of the USDCAD pair to around 60 pips. Retracement took place returning to the 30-period MA. The jump reached up to near 1.36730 resistance and retracement followed until it settled near 1.36450. The monthly figure was reported as 0.5% while the annual inflation rate cooled to 2.7% in April, likely giving the BoC ‘all clear’ for the June rate cut.
General Verdict:
 __________________________________________________________________
FOREX MARKETS MONITOR
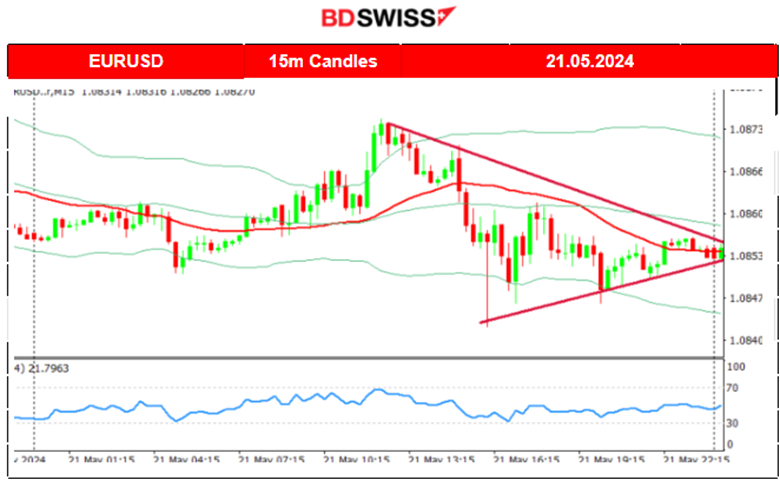
EURUSD (21.05.2024) 15m Chart Summary
Server Time / Timezone EEST (UTC+03:00)
Price Movement
The pair started to move to the upside after the beginning of the European session until it found resistance near 1.08750. Then it started to drop and it crossed the 30-period MA on its way down. Obviously, the news at 15:30 regarding inflation in Canada had some impact on the dollar causing the EURUSD to show some movement to the downside. Furthermore, several speeches took place during the day including Waller’s speech having an impact as well. After finding support at near 1.08430 the pair retraced to the MA and continued sideways with volatility levels getting lower and lower.
 ___________________________________________________________________
CRYPTO MARKETS MONITOR
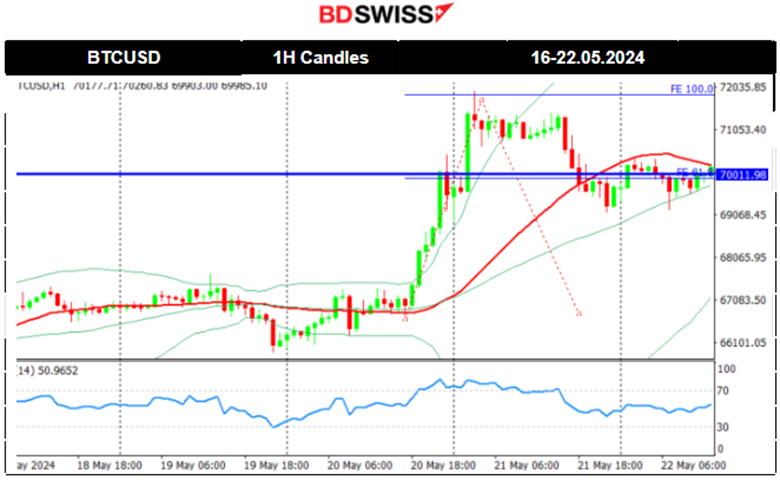
BTCUSD (Bitcoin) Chart Summary 1H
Server Time / Timezone EEST (UTC+03:00)
Price Movement
On the 17th of May, the price eventually moved upwards, crossing over the 67K USD level but remained close. Since that day a consolidation phase took place with the 30-period MA to turn sideways and the mean to remain at 67K USD. The price tested that resistance many times without success.
A jump occurred on the 20th of May with the price reaching 70K as mentioned in our previous analysis. It actually saw a further increase today with the price reaching a peak at 72K. Retracement also took place as expected and mentioned in our previous analysis back to the MA. Bitcoin settled near 70K USD and is stable for now.
 Crypto sorted by Highest Market Cap:
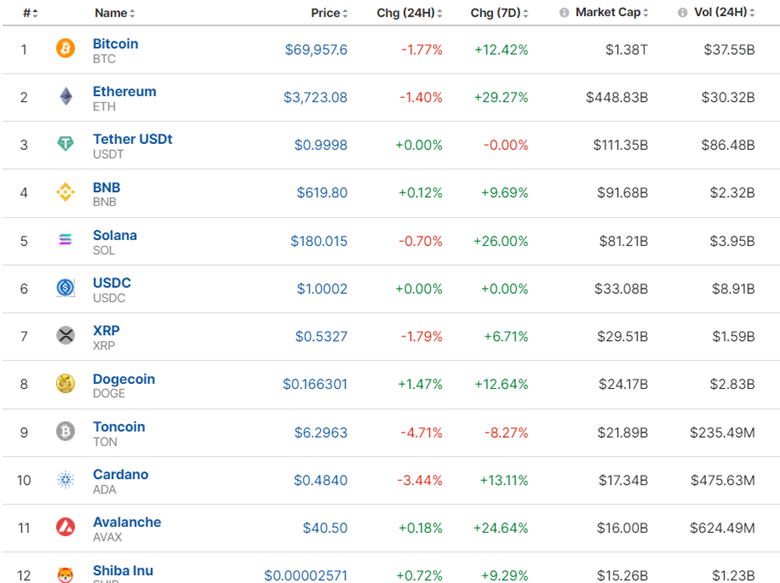
The market is stable and holds the gains generated after the boost on the 20th.
Source: https://www.investing.com/crypto/currencies
______________________________________________________________________
EQUITY MARKETS MONITOR
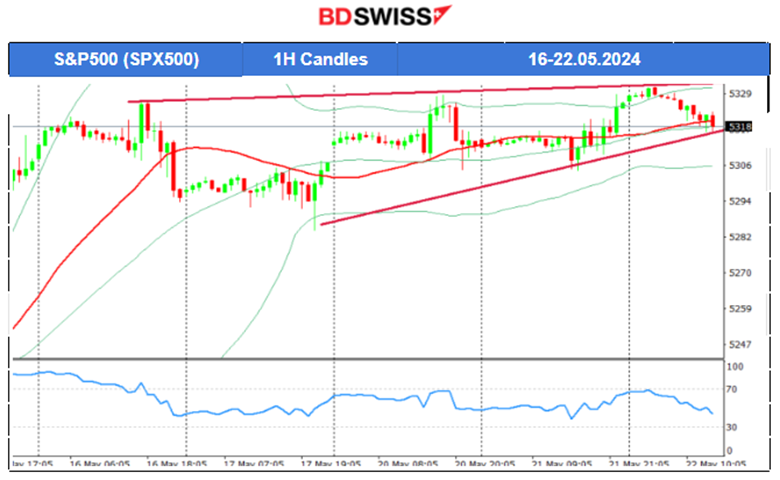
S&P500 (SPX500) 4-Day Chart Summary
Server Time / Timezone EEST (UTC+03:00)
Price Movement
On the 17th of May, the index moved with low volatility on the sideways and around the MA with a mean of 5,300 USD. On the 20th of May, the index saw a very volatile start to the stock market session moving to the upside, however, it reversed later rapidly back to the intraday MA and closed flat. We experienced mixed price path data for U.S. indices on the 20th of May. Very strange and rare to look at all three indices closing the sessions in 3 different directions. NAS100 jumped and closed higher while the SPX500 closed flat after a similar volatile session. US30 (Dow Jones) dropped instead. On the 21st of May, the index remained high and moved to the upside testing the highs for the 3rd time without success. A triangle formation/upward wedge is now visible with emerging trading opportunities upon the breakout of either side.
 ______________________________________________________________________
COMMODITIES MARKETS MONITOR
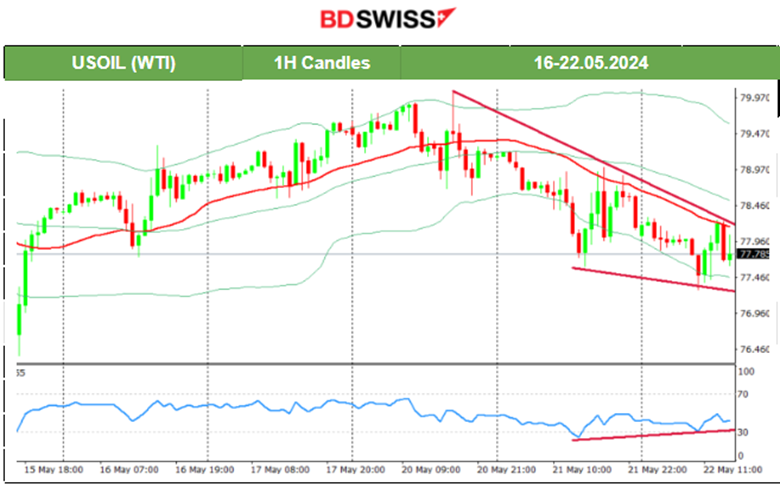
USOIL (WTI) 4-Day Chart Summary
Server Time / Timezone EEST (UTC+03:00)
Price Movement
After the news on the 16th of May, Crude oil started a steady path to the upside remaining above the MA. As mentioned in our previous analysis, the path looked like an upward wedge, if not a channel, that the price followed as it moved to the upside and a potential opportunity to trade upon breakout was taking place. The price eventually experienced a breakout to the downside moving away from the wedge and indicating the end of the uptrend. On the 21st of May, the price stayed below the 30-period MA and moved even lower today forming lower lows. The RSI has higher lows indicating a slowdown (bullish signal/divergence) while there is an upcoming downward wedge formation for now.
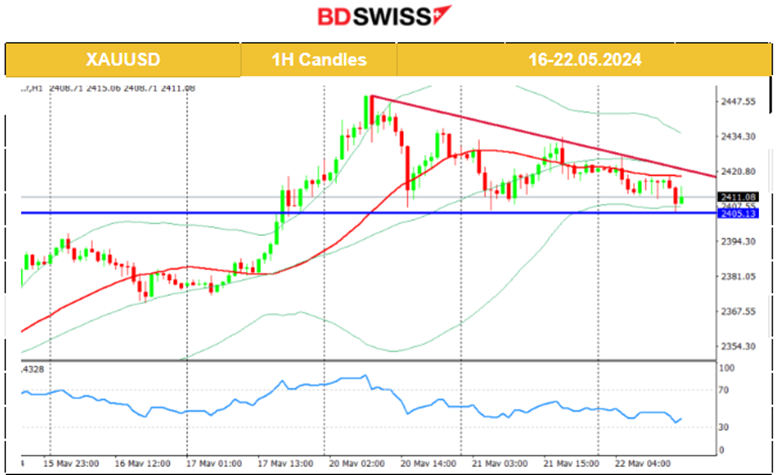
 XAUUSD (Gold) 4-Day Chart Summary
Server Time / Timezone EEST (UTC+03:00)
Price Movement
On the 20th the price continued with an upward and rapid movement but after reaching the peak of 2,450 USD/oz and in an overbought territory, the market decided to sell. The 61.8 Fibo level was reached as the price returned to the 2,400 USD/oz level. A triangle formation indicated the important support at 2,400 USD/oz and the potential to move to the downside upon breakout, to the 2,380 USD/oz level. Gold has however shown great potential for an upside movement and trend with a potential to break the triangle to the upside instead and test again that 2,450 USD/oz level in the future. Currently the price tests the support level at near 2,405 USD/oz for the third time without success.
 ______________________________________________________________
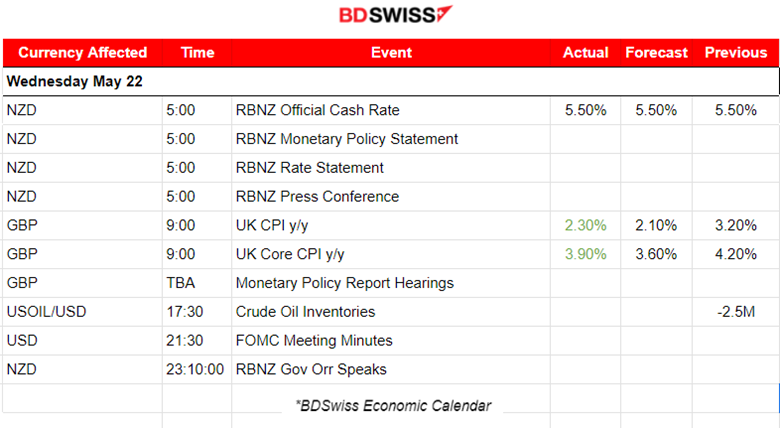
News Reports Monitor – Today Trading Day (22 April 2024)
Server Time / Timezone EEST (UTC+03:00)
- Midnight – Night Session (Asian)
The RBNZ decided to keep interest rates steady. Annual consumer price inflation is expected to return to within the Committee’s 1 to 3 percent target range by the end of 2024. NZD was appreciated heavily at that time. NZDUSD jumped near 50 pips and retracement followed. Statement monetary policy needs to be restricted.
- Morning – Day Session (European and N. American Session)
The Consumer Price Index (CPI) in the U.K. was reported lower but higher than expected. The U.K. which had the highest inflation peak of over 11% has managed to beat the U.S. (currently at 3.4%) by lowering it to 2.3% very close to the target level. The market reacted with GBP appreciation and the GBPUSD jumped 35 pips before retracing to the intraday MA.
General Verdict:
______________________________________________________________


