

Previous Trading Day’s Events (29 Feb 2024)
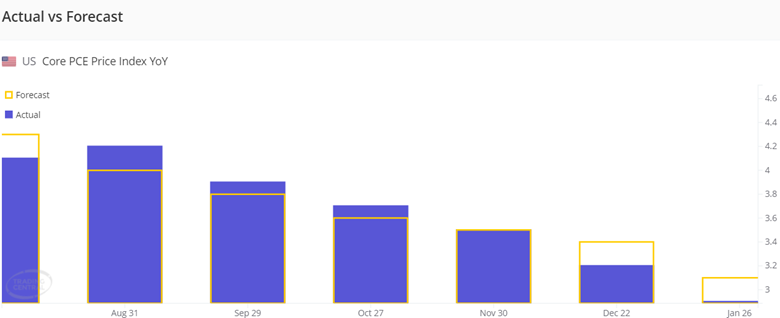
PCE, including the volatile food and energy categories, increased by 0.3% monthly and 2.4% on a 12-month basis, also in line.
Personal income rose 1%, well above the forecast of 0.3%. Spending decreased by 0.1% versus the estimate for a 0.2% gain.
Initial jobless claims totalled 215K for the week ended Feb. 24, up 13,000 from the previous period and more than the 210,000 estimate.
Source: https://www.cnbc.com/2024/02/29/pce-inflation-january-2023-.html
______________________________________________________________________
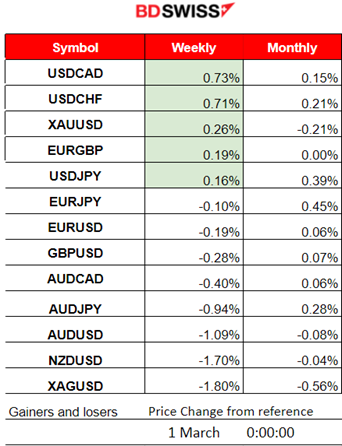
Winners vs Losers
USDCAD is still leading this week with 0.73% gains. The USD remains resilient even after the PCE report keeping USD (base) pairs high. New month, new performance.
 ______________________________________________________________________
News Reports Monitor – Previous Trading Day (29 Feb 2024)
Server Time / Timezone EEST (UTC+02:00)
- Midnight – Night Session (Asian)
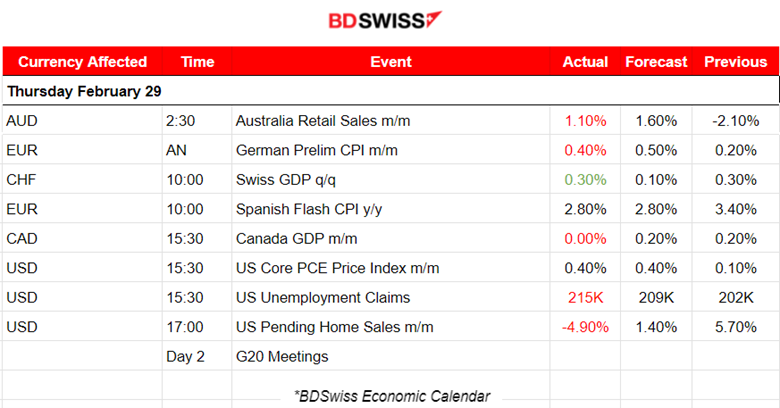
Australia’s Retail Sales report release at 2:30 showed growth of 1.10% but this was less than expected. No major impact was recorded at the time of the release, however, the AUD surprisingly appreciated against the USD and other currencies, soon after the release.
- Morning–Day Session (European and N. American Session)
Canada’s GDP report at 15:30 showed that Real gross domestic product (GDP) was essentially unchanged in December, following two months of growth. The market did not react heavily to the news, no special effect on CAD. However, the USDCAD dropped heavily due to the U.S. PCE report causing the dollar to depreciate heavily.
The U.S. Core PCE price index, a measure of inflation, fell to the lowest rate since early 2021, reports said yesterday at 15:30. Investors, home buyers and consumers alike are looking for interest rate cuts after this supporting evidence of further inflation cooling.
The market reacted with dollar depreciation after the release and that did not last long. The dollar soon after appreciated heavily.
U.S. Unemployment claims were reported at 15:30, higher than expected at 215K in the week ending February 24. This is however not a significant increase considering the volatility of these figures every week. In general, the labour market is not actually cooling, it is quite tight. The probability of an unchanged interest rate policy remains close to 80%. Chair Powell might change everything next week during his speech on the 6th March at 17:00. Will NFP next week play a role in future decisions for cuts? Definitely.
At 17:00 it was reported that U.S. Pending Home Sales fell by the most since August as borrowing costs remain high. Elevated mortgage rates kept a lid on housing demand.
General Verdict:
 __________________________________________________________________
FOREX MARKETS MONITOR
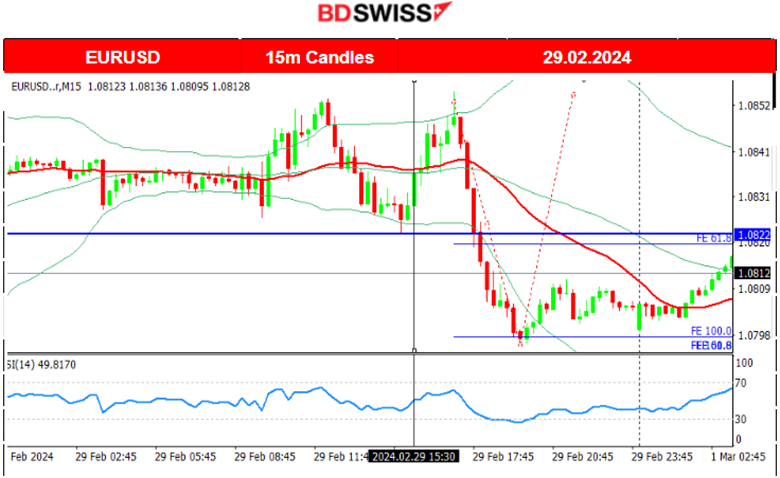
EURUSD (29.02.2024) 15m Chart Summary
Server Time / Timezone EEST (UTC+02:00)
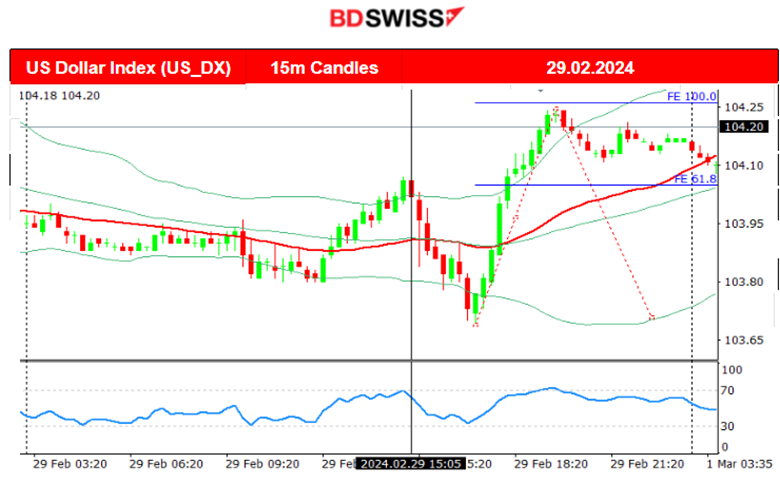
Price Movement
Volatility started to pick up near the start of the European session. The pair started to deviate from the mean significantly before the U.S. PCE report release with deviations from the 30-period MA reaching near 15 pips. After the release, the pair moved to the upside as the market reacted with a moderate intraday shock. The USD was experiencing depreciation at that time and the pair tested the resistance near 1.08550 once more before reversing to the downside heavily. It was after 17:00 that the USD started to appreciate heavily against the other currencies. After the pair reached a strong support, it finally retraced, back to the 61.8 Fibo level as depicted on the chart.
 ___________________________________________________________________
CRYPTO MARKETS MONITOR
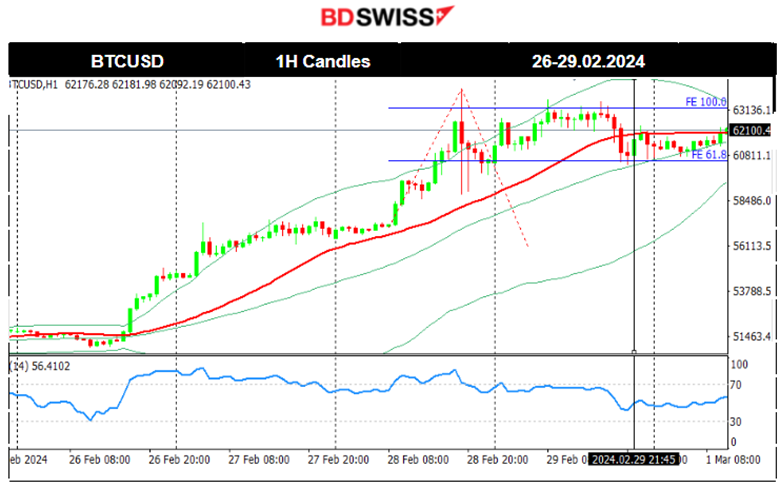
BTCUSD (Bitcoin) Chart Summary
Server Time / Timezone EEST (UTC+02:00)
Price Movement
The Bitcoin surge this week started on the 26th Feb. BlackRock Bitcoin ETF hit a record volume of over 1.3B USD for the second consecutive day. On the 28th Feb, another surprise surge took place having changed hands at as high as 63,933 USD overnight. Its monthly gain is more than 44%, the largest since December 2020. Currently, it remains in consolidation and settling near 62K USD.
Related article:
https://finance.yahoo.com/news/1-soaring-bitcoin-set-biggest-024417986.html
 Crypto sorted by Highest Market Cap:
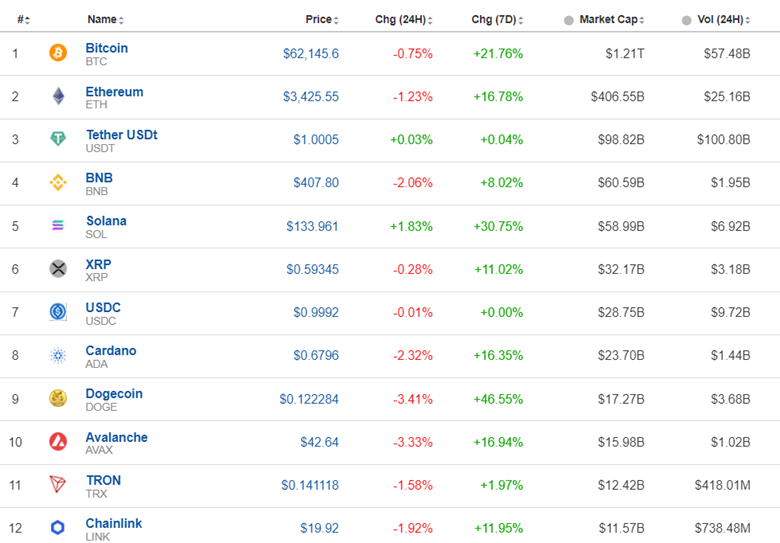
A clear high performance in the Crypto market due to risk-on mood and high investment amounts. LSEG data showed flows into the 10 largest spot bitcoin ETFs brought in $420 million on Tuesday alone. Bitcoin recorded high gains this week, with 7 days of performance reaching over 20% gains.
Source: https://www.investing.com/crypto/currencies
______________________________________________________________________
EQUITY MARKETS MONITOR
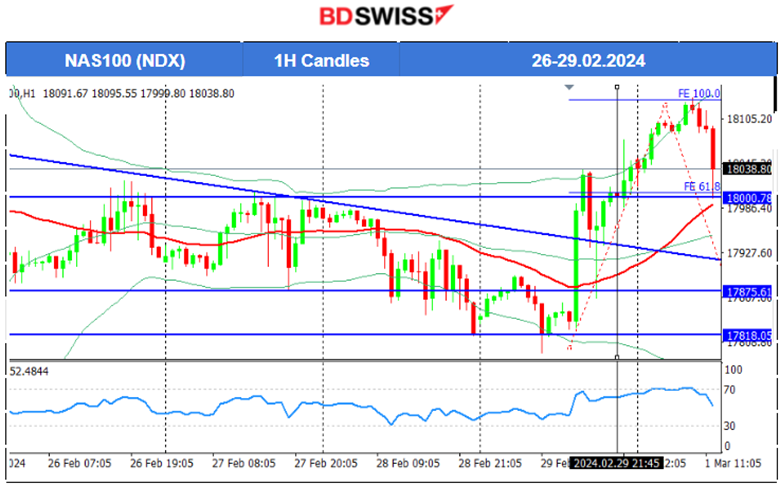
NAS100 (NDX) 4-Day Chart Summary
Server Time / Timezone EEST (UTC+02:00)
Price Movement
Global stocks rallied on the 21st Feb and after 22:00. All U.S. indices experienced a big jump to the upside. The tech-heavy Nasdaq 100 index jumped over 1.8%. The boss of Nvidia said artificial intelligence (AI) is at a “tipping point” as it announced record sales. It reported that revenues surged by 265% in the three months to 28th January, compared to a year earlier. On the 23rd Feb, the index moved to the upside further, breaking the 18,000 USD resistance level and reaching the one near the 18,100 USD before retracement took place. The index was facing consolidation for days, calming down after the surge. The retracement to the 61.8 Fibo level was nearly completed on the 28th Feb. On the 29th Feb all benchmark indices surged after the PCE report release showing a lower annual figure that caused the dollar to lose strength at that time. The momentum to the upside was strong enough to cause the index to move quite rapidly and further from the MA on its way up. Retracement followed today reaching the Fibo 61.8.
 ______________________________________________________________________
COMMODITIES MARKETS MONITOR
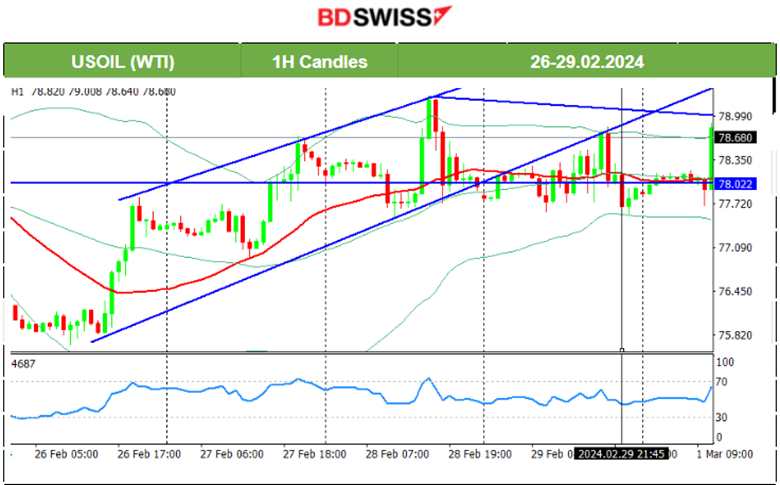
USOIL (WTI) 4-Day Chart Summary
Server Time / Timezone EEST (UTC+02:00)
Price Movement
On the 26th Feb Crude oil experienced a full reversal to the upside. The price reached the resistance 77.80 USD/b and retraced to the 61.8 Fibo level on the 27th Feb. The price continued with an upward movement reaching the next resistance at 78.75 USD/b before retracing again to the MA. On the 28th Feb, the pattern continued as the price was clearly on a short-term uptrend, however, after finding important resistance near 79.20 USD/b it reversed to the mean level at 78 USD/b. Sideways but volatile movement for Crude on the 29th Feb since a consolidation phase is in place.
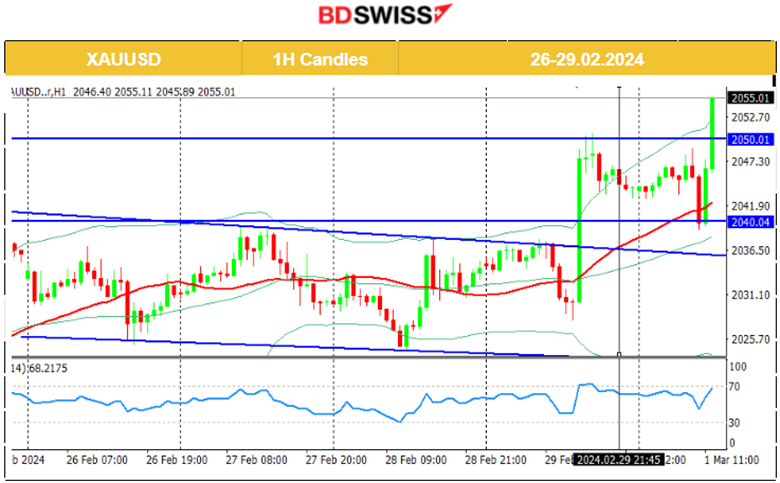
 XAUUSD (Gold) 4-Day Chart Summary
Server Time / Timezone EEST (UTC+02:00)
Price Movement
On the 23rd Feb, Gold moved to the downside, finding support at 2016 USD/oz and in a short period of time reversed significantly to the upside crossing the 30-period MA on its way up reaching the resistance at 2041 USD/oz. Since then, it moved sideways around the MA, with volatility levels getting lower and lower forming a triangle. That triangle has broken to the downside on the 28th Feb as the USD is gaining strength. On the same day, it reversed highly after reaching support and eventually came to test again the highs. A clear channel was visible as depicted on the chart mentioned in our previous analysis. An upside breakout occurred on the 29th Feb after the inflation report report. The surge continued though with Gold currently passing over 2050 USD/oz
 ______________________________________________________________
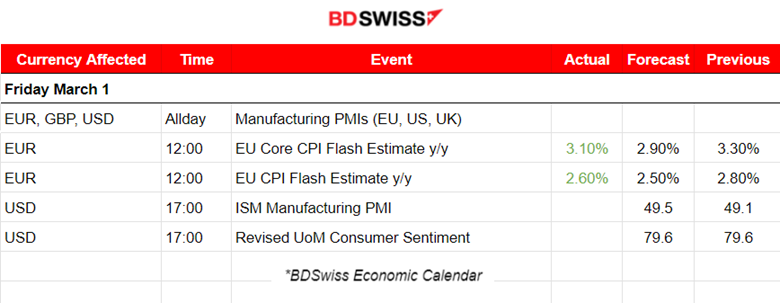
News Reports Monitor – Today Trading Day (01 Mar 2024)
Server Time / Timezone EEST (UTC+02:00)
- Midnight – Night Session (Asian)
No important announcements, no special scheduled releases.
- Morning – Day Session (European and N. American Session)
Good news for inflation in the Euro area. The annual inflation estimate was reported at 2.6% in February 2024, down from 2.8% in January according to a flash estimate from Eurostat. The core figure was also reported lower, but higher than expected. The EUR depreciated at the time of the release with a moderate shock occurring. EURUSD dropped nearly 20 pips during that time.
The ISM manufacturing PMI will add to the data regarding the manufacturing sector in the U.S. which is actually improving. The reported figure is expected to be closer to the 50-point threshold that separates contraction from expansion. A surprise would lead to USD pairs experiencing higher volatility during the release but no major shock is expected.
General Verdict:
______________________________________________________________


