Previous Trading Day’s Events (21 Dec 2023)
“Our tracking for fourth quarter GDP now suggests virtually no growth during the period, which is all the more disappointing given surging population growth,” said Desjardins Group economist Tiago Figueiredo.
“There is plenty to cheer about the economy, and next year should be even better as the Federal Reserve takes the brakes off the economy now that inflation is going their way,” said Christopher Rupkey, chief economist at FWDBONDS in New York.
The U.S. government confirmed that economic growth accelerated in the third quarter. Gross domestic product (GDP) increased at a 4.9% annualised rate last quarter (3rd), revised down from the previously reported 5.2% pace. The fastest pace of expansion since the fourth quarter of 2021.
“This is remarkable progress given that core inflation was at 6% annualised in early 2022,” said Gus Faucher, chief economist at PNC Financial in Pittsburgh, Pennsylvania.
“While risks to the economy remain, the recent loosening in financial conditions and fall in inflation are supportive of continued, albeit below-trend, growth into next year,” said Matthew Martin, a U.S. economist at Oxford Economics in New York.
______________________________________________________________________
Winners vs Losers
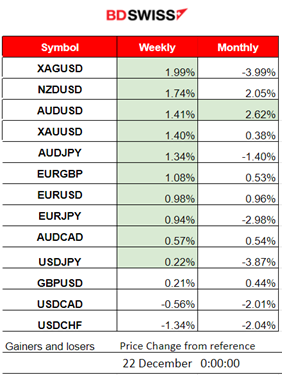
XAGUSD (Silver) is still on the top with 2% gains so far this week, followed next by USD pairs (USD as quote). AUDUSD is the top gainer this month so far with 2.62% gains.
______________________________________________________________________
News Reports Monitor – Previous Trading Day (21 Dec 2023)
Server Time / Timezone EEST (UTC+02:00)
- Midnight – Night Session (Asian)
No important news announcements, no special scheduled releases.
- Morning–Day Session (European and N. American Session)
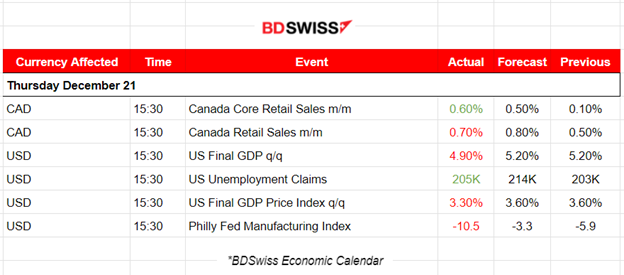
At 15:30, Canada’s retail sales data were released showing that they increased by 0.7%. Core retail sales were up 1.2% in October. In volume terms, retail sales increased 1.4% in October. The CAD depreciated surprisingly before the report release and then after the report, it unexpectedly appreciated heavily as the retail sales data showed higher numbers.
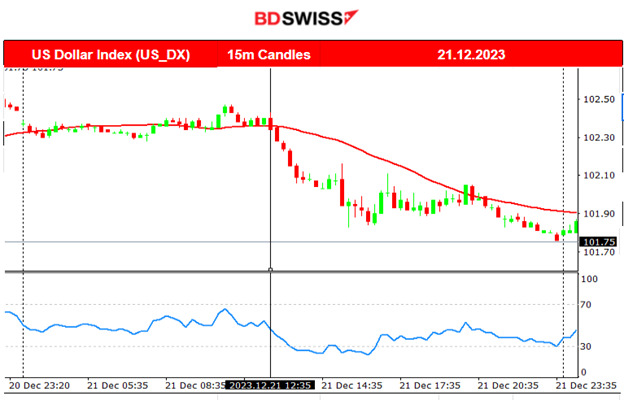
At the same time, the Real gross domestic product (GDP) for the 3rd quarter increased at an annual rate of 4.9%, according to the “third” estimate released by the Bureau of Economic Analysis. This is actually lower than the forecast and the previous figure of 5.20%. Unemployment claims remain close to 200K. Obviously manufacturing activity in the region continued to decline overall, according to the information firms are providing to the December Manufacturing Business Outlook Survey. The Philly Fed Manufacturing Index showed a way more negative than expected figure, -10.5 versus -3.3.
General Verdict:
____________________________________________________________________
FOREX MARKETS MONITOR
EURCAD (21.12.2023) Chart Summary
Server Time / Timezone EEST (UTC+02:00)
Price Movement
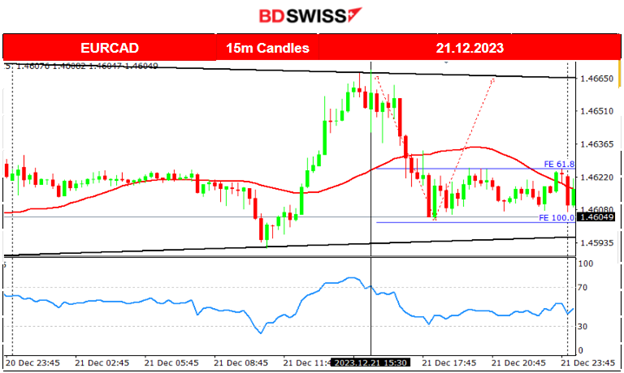
The pair was moving sideways with low volatility during the Asian session and early start of the European session but it soon saw more volatility. After 9:00 the EURCAD jumped higher until the resistance near 1.46690 when the CAD actually experienced depreciation before the news at 15:30. After the news release the retail sales report showed increased figures that caused a CAD appreciation and the pair to drop, reversing from the upside, crossing the 30-period MA until it reached the support near 1.46050. Retracement back to the MA followed soon and the pair reached the 61.8 Fibo level.
___________________________________________________________________
CRYPTO MARKETS MONITOR
BTCUSD (Bitcoin) 4-Day Chart Summary
Server Time / Timezone EEST (UTC+02:00)
Price Movement
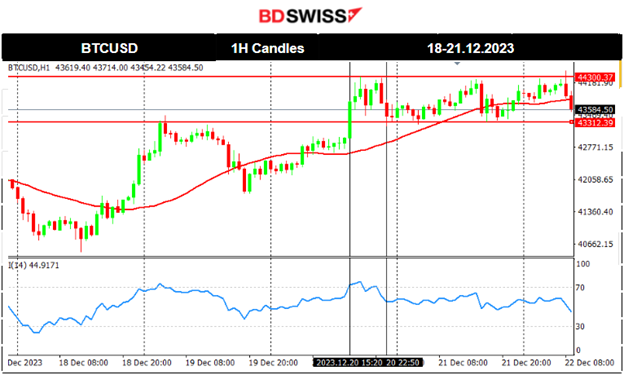
On the 18th Dec, Bitcoin’s price reversed remarkably to the upside. Bitcoin crossed the 30-period MA on its way up and moved beyond the 42300 USD resistance reaching eventually the next resistance at 43300 USD. Retracement took place eventually fully and bitcoin settled to a path around the 30-period MA and the mean near 42700 USD. Bitcoin managed to break the high resistance at 43300 USD reaching 44300 USD before retracing back to the previous resistance level that now became a support (43300). It currently remains within that support and resistance range as per the chart.
Crypto sorted by Highest Market Cap:
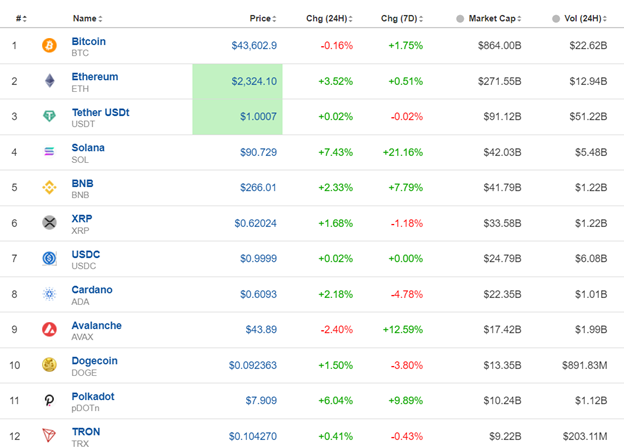
Most crypto maintained their good performance for the last 24 hours. Solana is the top performer for the last 7 days with nearly 21.16% gains so far.
Source: https://www.investing.com/crypto/currencies
______________________________________________________________________
EQUITY MARKETS MONITOR
NAS100 (NDX) 4Hour Timeframe Chart Summary
Server Time / Timezone EEST (UTC+02:00)
Price Movement
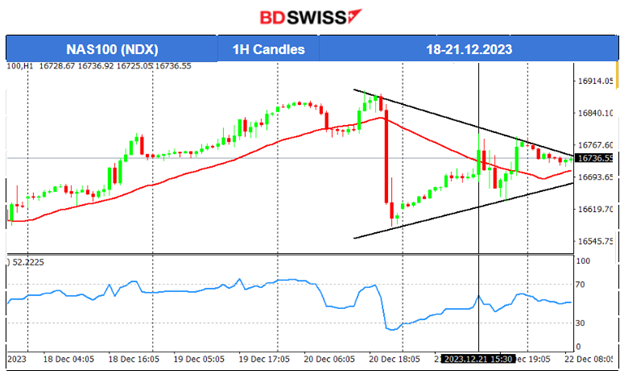
The risk-on sentiment was fairly interrupted as market participants caused a crash intraday of the U.S. stock market yesterday after 21:00. According to the reports, the U.S. existing home sales rose unexpectedly in November, and, amid optimism about the labour market, the Conference Board said its consumer confidence index increased to 110.7 this month comparing well to economist expectations for 104.0 and November’s downwardly revised 101.0. In the U.S., 10-year Treasury yields fell to an almost five-month low as government bond yields fell globally after the British inflation data. NAS100 and other indices were clearly on an uptrend when suddenly indices fell dramatically. The NAS100 experienced a near 300-dollar fall before retracing. A triangle formation is apparent and traders now should anticipate a breakout upon rising volatility levels on exchange opening.
COMMODITIES MARKETS MONITOR
USOIL (WTI) 4-Day Chart Summary
Server Time / Timezone EEST (UTC+02:00)
Price Movement
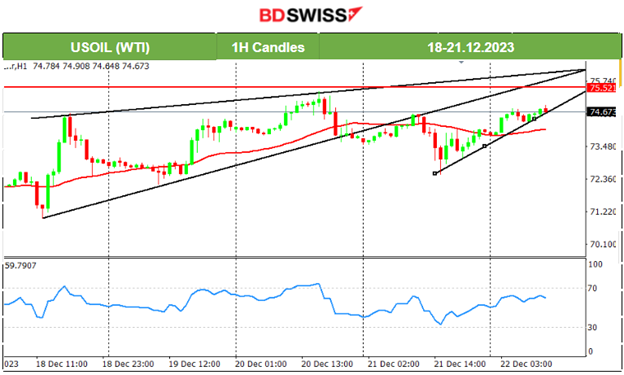
Crude oil moves sideways in general with high volatility. We see that the path is around the 30-period moving average and periodically it experiences big deviations from the MA while following that path. On the 20th Dec, the price crossed the 30-period MA ending an intraday upward but steady trend and now it seems to have great resilience to the downside even when news releases indicate that Angola is leaving the OPEC oil cartel after 16 years, after a dispute over the production cuts. Let’s see if the sideways path will continue. A probable scenario is that Crude oil could reach higher levels, since it crossed the MA again to the upside this time, with the first probable stop at the resistance near 75.50 USD/b.
XAUUSD (Gold) 4-Day Chart Summary
Server Time / Timezone EEST (UTC+02:00)
Price Movement
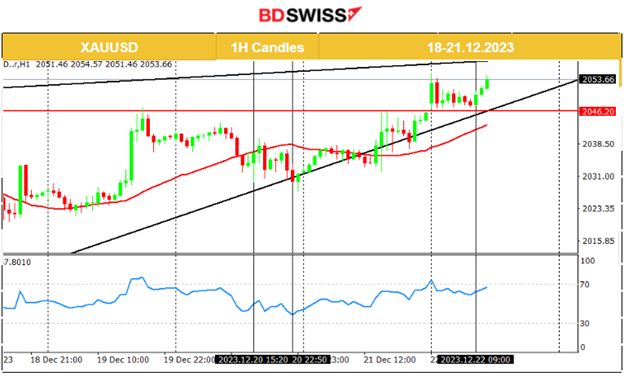
Since the 18th Dec, Gold has experienced an upward movement. It reached the 2046 USD/oz level on the 19th Dec but could not break it. It eventually moved downwards yesterday back to the support of 2030 USD/oz before retracing back to the 30-period MA and the mean around 2035 USD/oz. On the 21st Dec, it broke the resistance at near 2046 USD/oz and moved higher to test the resistance at near 2054 USD/oz. It currently settles near that level and tests it for a breakout to the upside.
______________________________________________________________
News Reports Monitor – Today Trading Day (22 Dec 2023)
Server Time / Timezone EEST (UTC+02:00)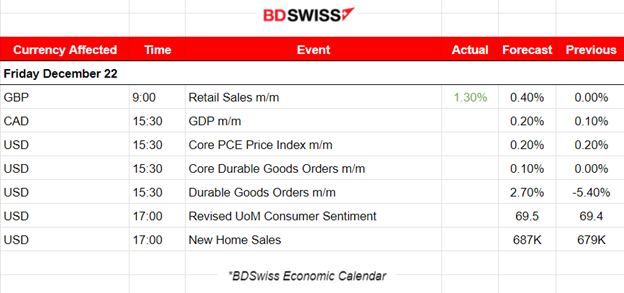
- Midnight – Night Session (Asian)
No important news announcements, no special scheduled releases.
- Morning–Day Session (European and N. American Session)
The U.K.’s retail sales figures were released showing that sales volumes have increased by 1.3% in November 2023, from no growth (revised from a fall of 0.3%) in October 2023. The market reacted with GBP appreciation that lasted for a while and did not have much impact. The GBPUSD jumped 30 pips at the time of the release and reversed to the mean soon after.
Canada’s GDP monthly change is going to be reported later at 15:30. The forecast is a higher figure. CAD pairs could see volatility increase at that time but moderate.
The PCE Price index figure on the 22nd probably will cause intraday shock for the USD pairs as it is an important figure related to inflation. It is released with the Durable Goods orders reports and the market could see volatility levels rise moderately at that time.
The revised UoM Consumer Sentiment figure will be reported at 17:00 and could cause the dollar to be affected greatly if a surprise takes place.
General Verdict:
______________________________________________________________


