PREVIOUS TRADING DAY EVENTS – 09 June 2023
Announcements:
The Bank of Canada decided to raise its overnight rate to a 22-year high of 4.75% on Wednesday since inflation was stubbornly high. The bank struggles to bring down inflation which remained more than double its 2% target in April. On Thursday, Bank of Canada Deputy Governor Paul Beaudry highlighted that a tight labour market and sticky core inflation contributed greatly to the decision to hike.
“Some cracks appeared within the Canadian labour market in May, but these may not yet be wide enough to convince the Bank of Canada that inflation is about to meaningfully cool off,” said Andrew Grantham, senior economist, CIBC Capital Markets.
“While this is an ugly set of jobs data, the labour force survey is notoriously volatile,” said Royce Mendes, head of macro strategy at Desjardins Group. “It would need to be corroborated with a host of additional information to change our view that the Bank of Canada will hike again in July.”
_____________________________________________________________________
Summary Daily Moves – Winners vs Losers (09 June 2023)
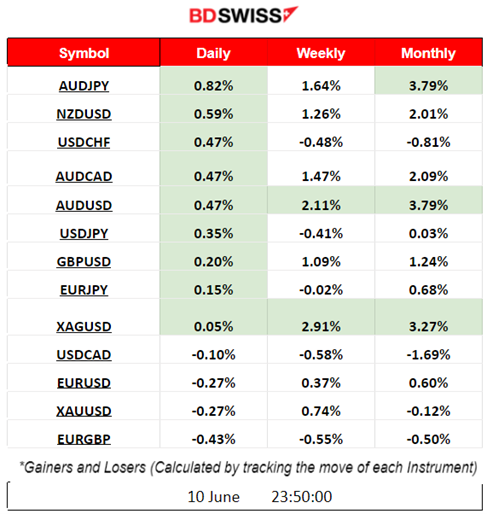
- AUDJPY was on the top of the winners’ list on Friday with 0.82% gains followed by NZDUSD with 0.59%.
- XAGUSD (Silver) reached the top last week with 2.91% price change.
- The month finds AUD pairs (AUDJPY and AUDUSD) on top so far leading with 3.79% gains.
______________________________________________________________________
News Reports Monitor – Previous Trading Day (09 June 2023)
Server Time / Timezone EEST (UTC+03:00)

- Midnight – Night Session (Asian)
No significant news announcements, no special scheduled releases.
- Morning – Day Session (European)
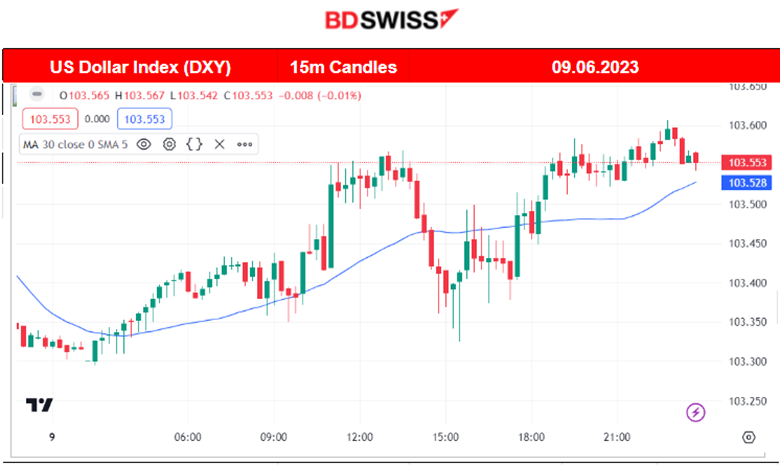
At 15:30 the important Labor Market data for Canada was released. The employment change was surprisingly a negative figure, -17.3K, way much lower than the forecast, while the unemployment rate increased by 0.20%.
This surprise caused an intraday shock with CAD depreciating at the time of the release. The impact was not so great, USDCAD jumped nearly 30 pips.
General Verdict:
______________________________________________________________________
FOREX MARKETS MONITOR
EURUSD (09.06.2023) Chart Summary
Server Time / Timezone EEST (UTC+03:00)
Price Movement
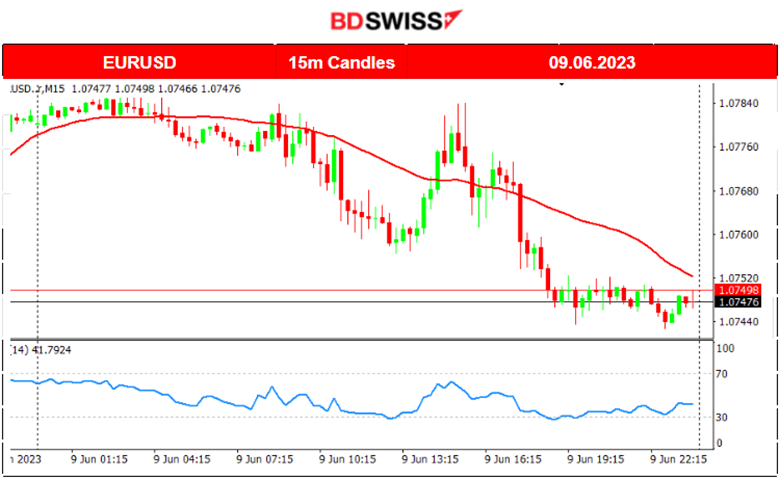
On Friday, the pair started to show high volatility after the European Markets’ opening mainly because of the activity that affected the USD. The USD appreciated overall. The pair moved on a downward but volatile path and ended its steady movement near the support of 1.0743. No retracement took place that day.
USDCAD (09.06.2023) Chart Summary
Server Time / Timezone EEST (UTC+03:00)
Price Movement
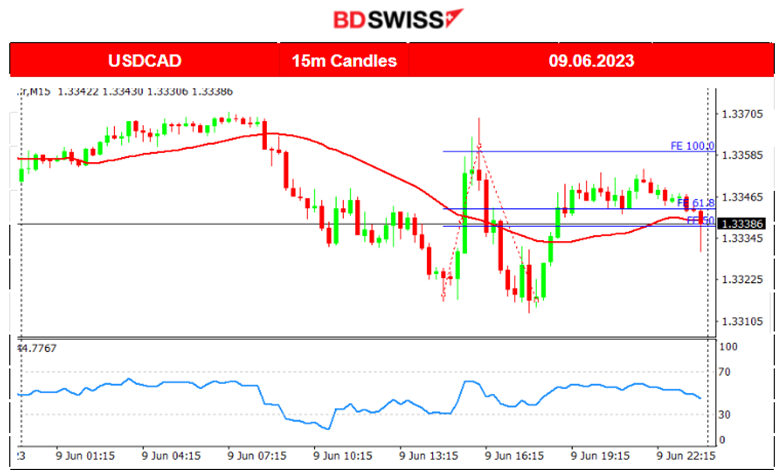
USDCAD had a similar path to EURUSD since both paths were driven by the USD mostly. At first, it started to drop steadily and showed high volatility after the beginning of the European session. The Labor market data release for Canada at 15:30 caused the pair to jump from CAD’s depreciation and price and therefore it reversed crossing the MA and moving upwards before retracing back to the mean and beyond. The pair found support at near 1.33130 and reversed again going above the MA on a sideways path until the end of the trading day.
____________________________________________________________________
EQUITY MARKETS MONITOR
NAS100 (NDX) 4-Day Chart Summary
Server Time / Timezone EEST (UTC+03:00)
Price Movement
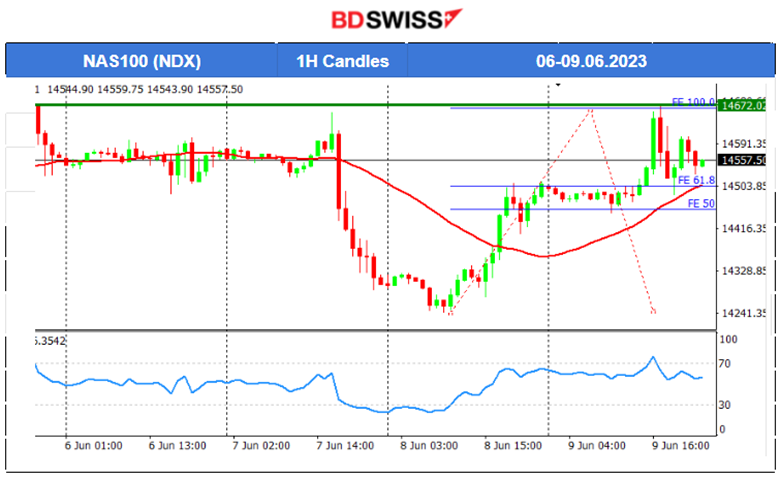
On the 7th of June, the index crashed after 17:00, near a 300 USD drop. This was after the BOC rate figure release at that time and the USD appreciation that followed immediately after. NAS100 dropped further following the next day, 8th June, and found significant support at nearly 12245 USD. It later retraced during the day back to the mean. With the release of the high U.S. Unemployment claim figures, the index moved rapidly upwards. On the 9th of June, after the NYSE opening, the stock market experienced an upward shock in general. The index jumped and tested once more the resistance of 14672 USD before retracing back to the intraday mean.
______________________________________________________________________
COMMODITIES MARKETS MONITOR
USOIL (WTI) 4-Day Chart Summary
Server Time / Timezone EEST (UTC+03:00)
Price Movement
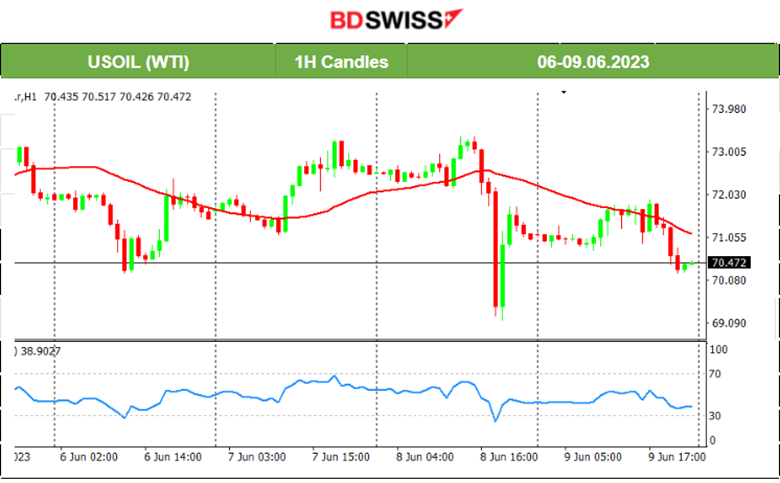
The price of Crude was steady the last few days, with sideways movement around the 30-period MA. On the 8th of June, after the U.S. Unemployment claims figures were released, the price dropped rapidly finding resistance at 69 USD/b before retracing significantly. The claims were higher than the forecast, shifting the expectations towards a pause in hikes. This weak data caused turmoil and USD depreciated while actually crude dropped. On the 9th of June, its price experienced lower volatility and a drop overall settling at 70.4 UD/b.
XAUUSD (Gold) 4-Day Chart Summary
Server Time / Timezone EEST (UTC+03:00)
Price Movement
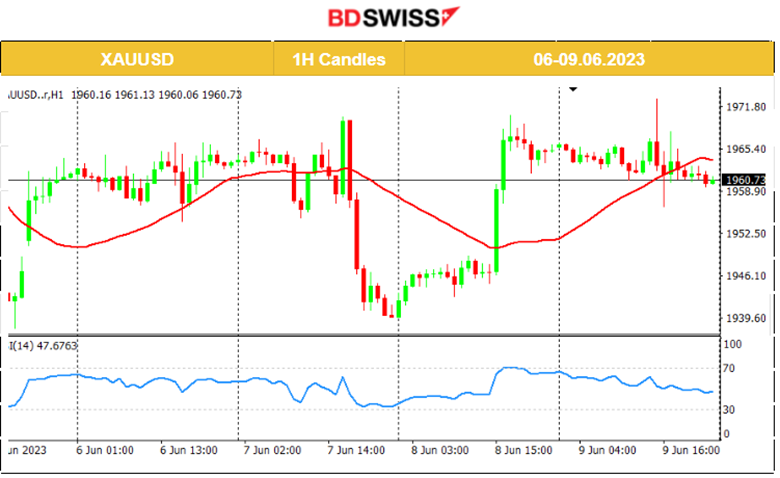
On the 7th of June, after 17:00, the USD appreciated greatly causing Gold’s price to crash and test the 1938 USD/oz support. Later on, it retraced fully back to the 61.8 Fibo level and even jumped further upwards when the USD depreciated greatly on the 8th of June after the high unemployment claims figures were released. It remained on a sideways path until the end of the week, even though on Friday it experienced a low-level intraday shock possibly affected by the CAD news at 15:30.
______________________________________________________________
News Reports Monitor – Today Trading Day (12 June 2023)
Server Time / Timezone EEST (UTC+03:00)
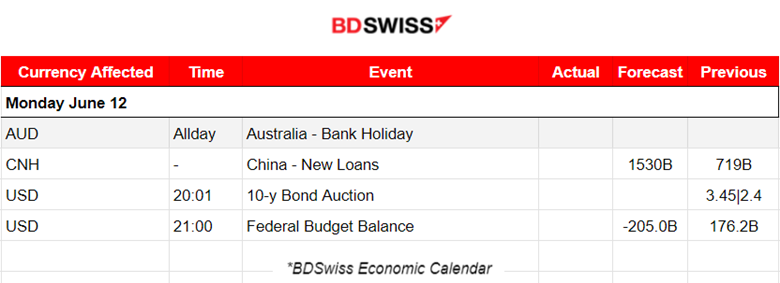
- Midnight – Night Session (Asian)
No significant news announcements, no special scheduled releases.
- Morning – Day Session (European)
No significant news announcements, no special scheduled releases.
General Verdict:
______________________________________________________________


