Previous Trading Day’s Events (10.06.2024)
______________________________________________________________________
Winners vs Losers
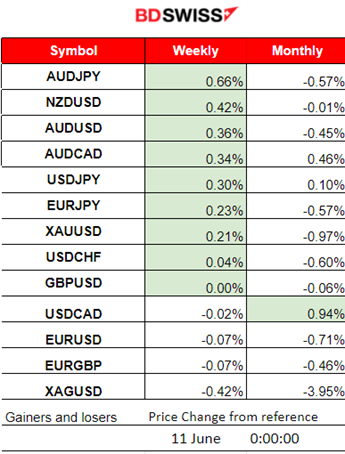
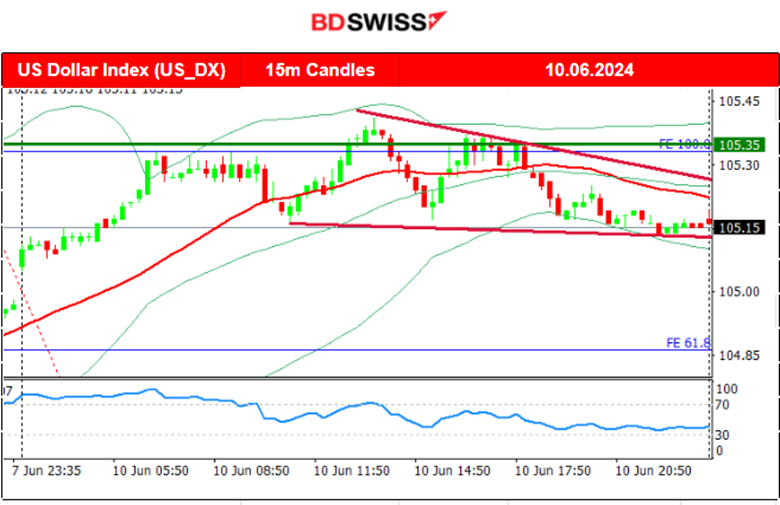
AUDJPY is currently leading for the week with 0.66% gains. It seems that the JPY is losing ground again as well while the AUD is gaining strength. The U.S. dollar was stable yesterday.
 ______________________________________________________________________
News Reports Monitor – Previous Trading Day (10.06.2024)
Server Time / Timezone EEST (UTC+03:00)

- Midnight – Night Session (Asian)
No important news announcements, no special figure releases.
- Morning – Day Session (European and N. American Session)
No important news announcements, no special figure releases.
General Verdict:
 __________________________________________________________________
FOREX MARKETS MONITOR
EURUSD (10.06.2024) 15m Chart Summary
Server Time / Timezone EEST (UTC+03:00)
Price Movement
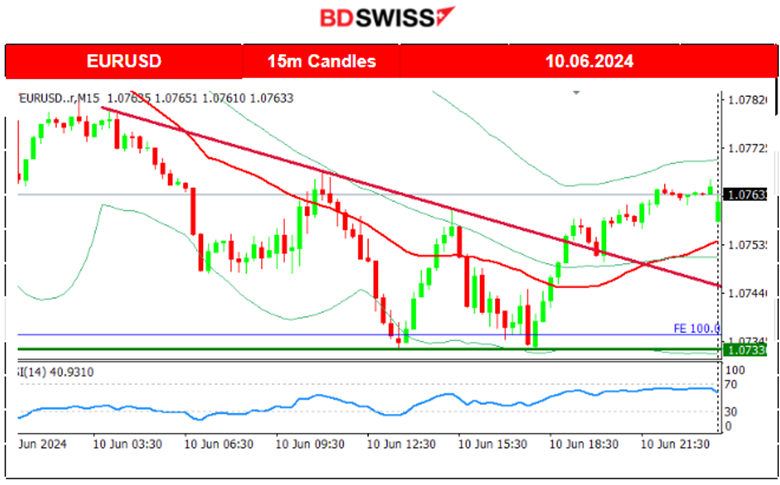
With the absence of important scheduled figure releases volatility was moderate. The pair moved lower in a downward intraday trend as the dollar saw some further appreciation that did not last for long. The pair reached an intraday support near 1.0733 and the dollar started to depreciate after two unsuccessful breakouts reversing to the upside.
 ___________________________________________________________________
CRYPTO MARKETS MONITOR
BTCUSD (Bitcoin) Chart Summary 1H
Server Time / Timezone EEST (UTC+03:00)
Price Movement
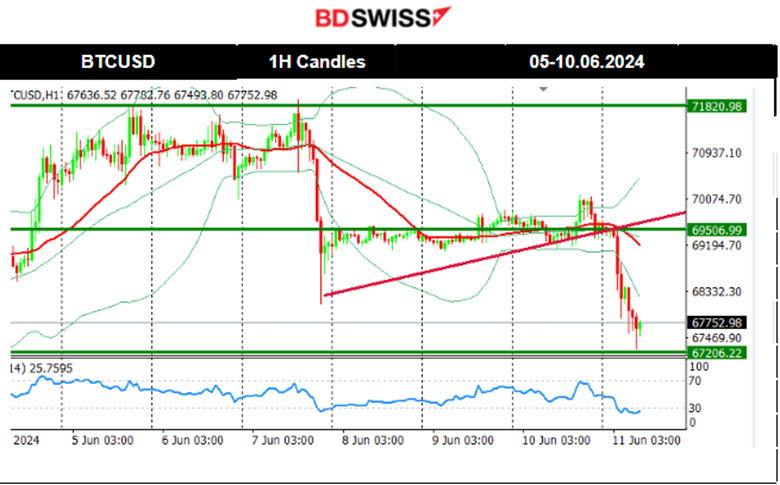
The price had stalled at the resistance near 69K USD even after the volatile market conditions that took place on the 3rd during the PMI releases. Since the 3rd of June, Bitcoin gained momentum and moved to the upside. It steadily broke resistance levels, 68K, 69K, 70K and lastly 71K. That changed on Friday, 7th of June, with the NFP news release that caused dollar appreciation and bitcoin’s price to crash near 3000 USD. Retracement took place with the price settling at 69.5K USD. After some consolidation that lasted since the 11th of June, the price eventually crashed further, reaching a support near 67,200 USD. It may experience some retracement to 68K next.
 Crypto sorted by Highest Market Cap:
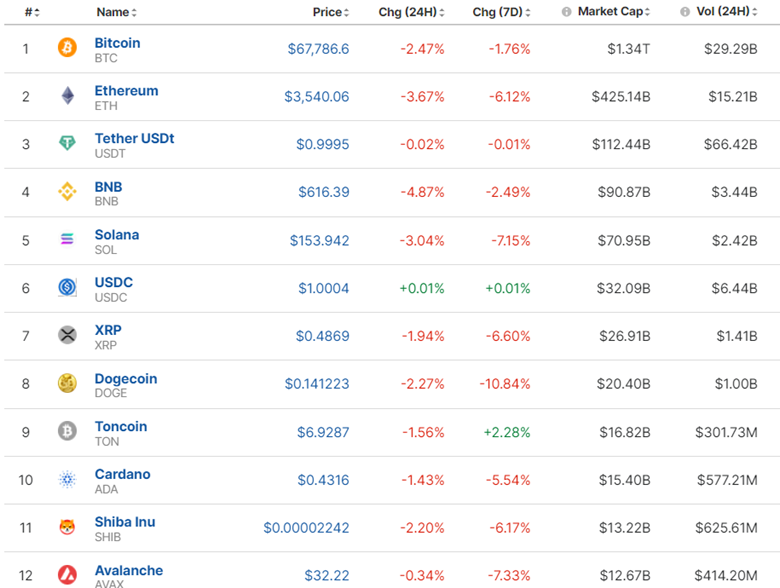
The Crypto market is suffering after two consecutive declines in Crypto values. The 24-hour and 7-day period columns became red as any gains last month were wiped out.
Sources:
https://www.investing.com/crypto/currencies
______________________________________________________________________
EQUITY MARKETS MONITOR
S&P500 (SPX500) 4-Day Chart Summary
Server Time / Timezone EEST (UTC+03:00)
Price Movement
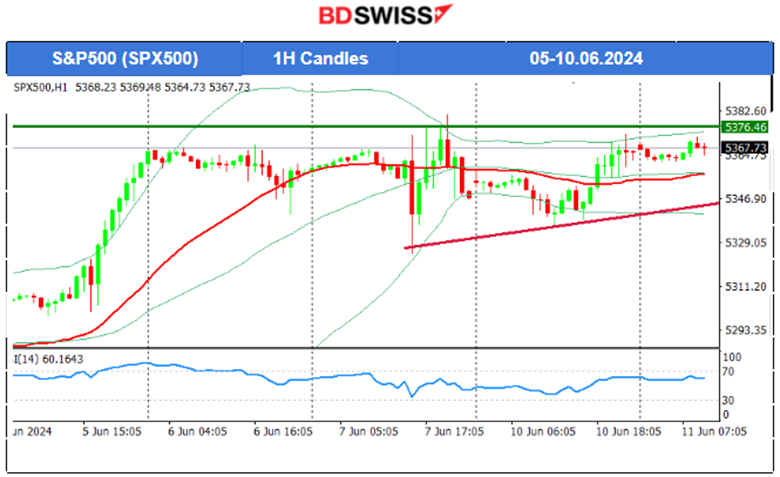
The market was quite volatile upon the release of the employment figures for the U.S. on the 7th of June. The dollar appreciated while stocks plunged at that time completing the retracement to 61.8% of the long movement upwards that started on the 4th. The index soon reversed though back to the 30-period MA and remained stable. On the 10th of June, the index moved sideways but with moderate volatility and with several unsuccessful tests for a breakout of the resistance at near 5,373 USD. A triangle formation could be formed at the moment as we approach the day of the CPI releases for the U.S. this week.
 ______________________________________________________________________
COMMODITIES MARKETS MONITOR
USOIL (WTI) 4-Hour Chart Summary
Server Time / Timezone EEST (UTC+03:00)
Price Movement
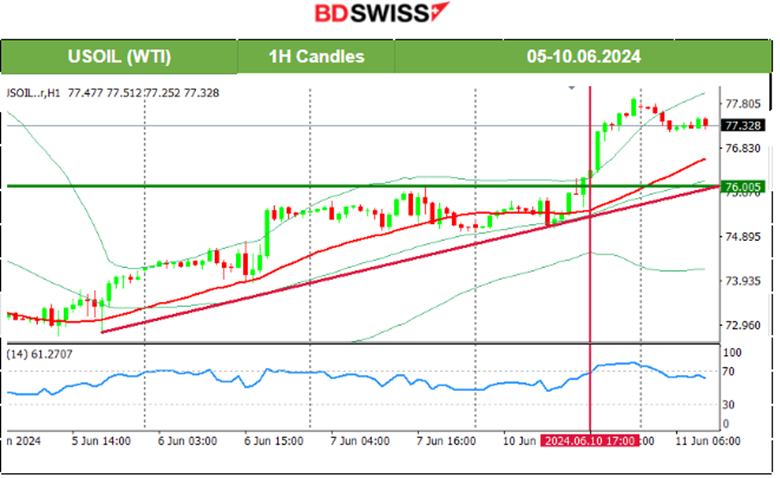
The price of crude oil eventually retraced, as mentioned in our previous analysis. It was a long way down until the 4th and the RSI indicated a slowdown and possible bullish divergence increasing the chances for retracement. Retracement reached the 74.5 USD/b level on the 6th of June and moved further to the upside after the release of the higher unemployment claims for the U.S. On the 7th the market experienced some moderate volatility but the price remained stable moving sideways. It settled near 75.4 USD/b. The 76 USD/b resistance level was breached on the 10th of June and the price jumped higher reaching the next resistance at near 77.80 USD/b with retracement taking place. It seems to be a clear uptrend for now. However, the price might retrace further near the 76.7 USD/b.
 XAUUSD (Gold) 4-Day Chart Summary
Server Time / Timezone EEST (UTC+03:00)
Price Movement
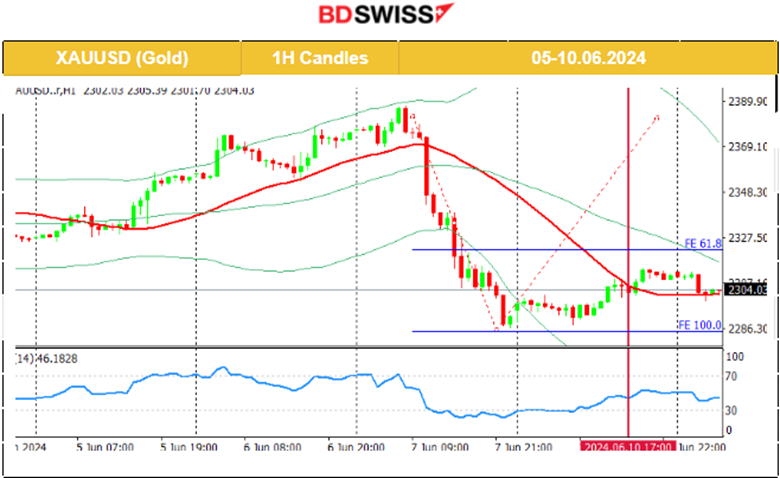
On the 5th of June, the price jumped reaching 2,375 USD/oz, before retracement took place. The price continued to move higher on an uptrend and above the 30-period MA. On the 7th of June, Gold saw a sudden drop of 20 dollars passing the first support, indicating an uptrend stop. GOLD dropped ahead of NFP on Friday though. Data showed that China’s central bank didn’t buy any gold last month, ending a massive buying spree that ran for 18 months. Gold’s price had already dropped since 11:00 server time on Friday, near 90 dollars drop for the day. As per our previous analysis, a retracement took place for the price to correct from the huge drop. Currently, the price settled near 2,300 USD/oz.
 ______________________________________________________________
News Reports Monitor – Today Trading Day (11.06.2024)
Server Time / Timezone EEST (UTC+03:00)

- Midnight – Night Session (Asian)
No important news announcements, no special figure releases.
- Morning – Day Session (European and N. American Session)
The change in the number of people claiming unemployment-related benefits during the previous month was reported way higher at 50.4K versus the expected 10.2K. Unemployment rate rose to 4.4%. The average Earnings Index (3m/y) was reported steady at 5.90%. The figures continue to show signs that the labour market may be cooling, with the number of vacancies still falling and unemployment rising. The market reacted with GBP depreciation at the time of the release. More than 14 pips drop for GBPUSD, reaching near 20 pips drop a while later, before retracing eventually to the intraday mean.
General Verdict:
______________________________________________________________


