PREVIOUS TRADING DAY EVENTS – 07 August 2023
According to the latest announcement, annual inflation figures were reported lower, at 3%. The market expected an increase for the next report to 3.30%. That is actually surprising to me. Rate hikes have proved that they have a great impact on inflation. The central bank was expected to pause for now but according to the recent Fed statements, another hike is on the way.
According to the Federal Reserve Governor Michelle Bowman, the U.S. central bank might raise rates further:
“I supported raising the federal funds rate at our July meeting, and I expect that additional increases will likely be needed to lower inflation to the FOMC’s goal,” Bowman said, referring to the Federal Open Market Committee in remarks prepared for a central bank Fed Listens event in Atlanta.
Of course, any decisions will depend on the incoming economic data.
“I will be looking for evidence that inflation is on a consistent and meaningful downward path as I consider whether further increases in the federal funds rate will be needed, and how long the federal funds rate will need to remain at a sufficiently restrictive level,” she said.
The Fed’s July rate hike brought the federal funds rate to a range of 5.25% to 5.5%.
“We have made progress in lowering inflation over the past year, but inflation is still significantly above the FOMC’s 2% target..” Bowman said.
______________________________________________________________________
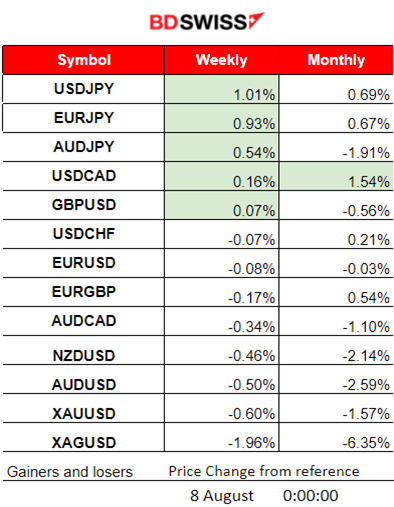
Winners vs Losers
______________________________________________________________________
News Reports Monitor – Previous Trading Day (07 August 2023)
Server Time / Timezone EEST (UTC+03:00)

- Midnight – Night Session (Asian)
No major news announcements and no major scheduled releases.
- Morning – Day Session (European)
No major scheduled releases so, no shocks. Some volatility is expected after the start of the European Session.
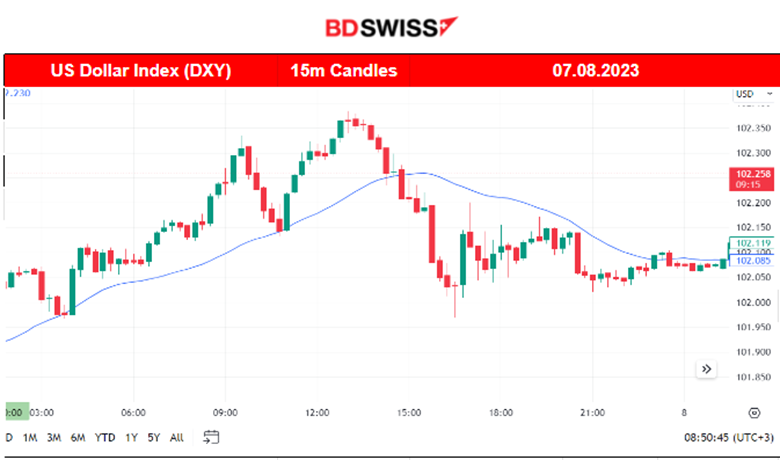
General Verdict:
____________________________________________________________________
FOREX MARKETS MONITOR
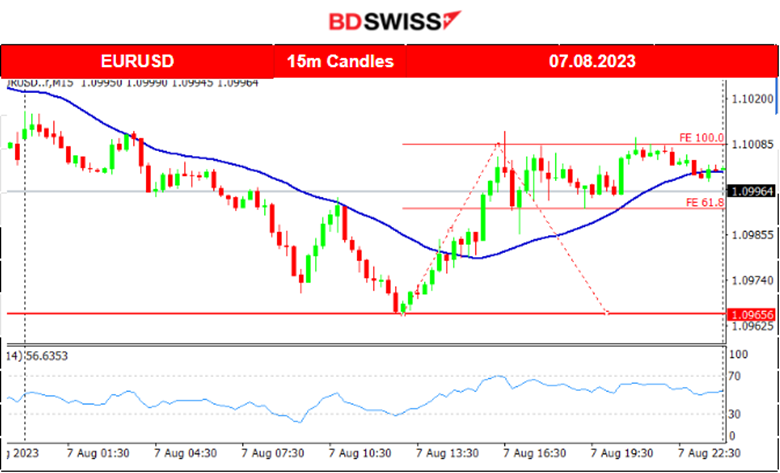
EURUSD (07.08.2023) Chart Summary
Server Time / Timezone EEST (UTC+03:00)
Price Movement
There was less volatility yesterday since it was Monday and with the absence of important scheduled releases. The pair moved to the downside initially, below the 30-period MA, and after the start of the European session, it found support at levels near 1.09656. After that, it reversed crossing the MA, on its way up reaching the resistance of 1.10085. Retracement followed back to the mean and the 61.8 Fibonacci level as depicted on the chart.
___________________________________________________________________
EQUITY MARKETS MONITOR
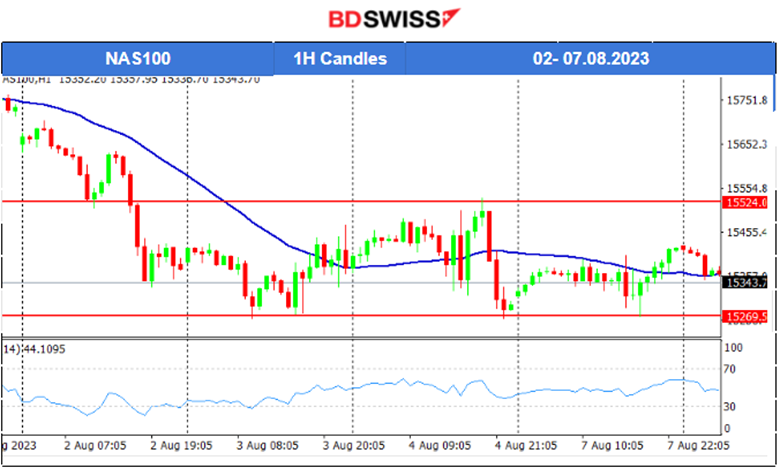
NAS100 (NDX) 4-Day Chart Summary
Server Time / Timezone EEST (UTC+03:00)
Price Movement
The U.S. stock market experienced high volatility recently but did not show any significant signal that the crash it experienced after the Fitch Ratings actually ended. After yesterday’s NFP release, the benchmark indices actually had not been affected significantly. Only after the market opened at 16:30, they eventually resulted in a drop. Now, they are testing important support levels, just like the NAS100, as depicted near 15260. If they eventually brake, they might trigger a downtrend signal. The RSI signals a bullish divergence and that’s why the support is actually significant. A clear consolidation phase is taking place for now, as the index is in range.
______________________________________________________________________
COMMODITIES MARKETS MONITOR
USOIL (WTI) 4-Day Chart Summary
Server Time / Timezone EEST (UTC+03:00)
Price Movement
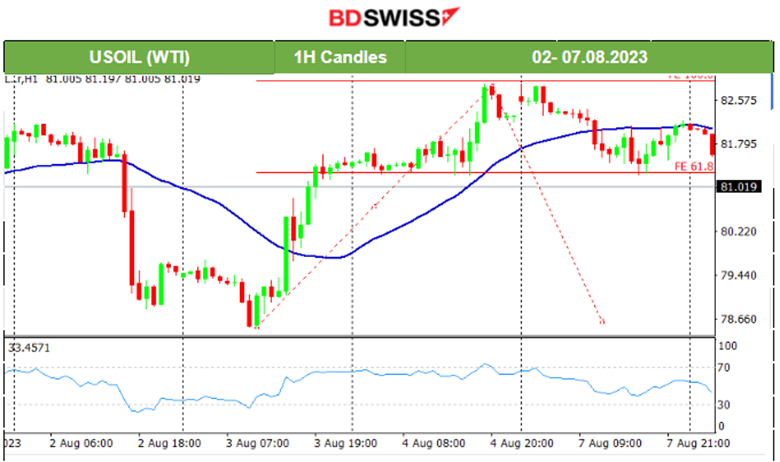
A negative figure of -17M showed that during the previous week, way less amount had remained in inventories. Yesterday, the price showed early signs of bullish divergence, with lower lows, while the RSI showed higher lows. At the start of the European session, the price eventually jumped, reversing, crossing the MA and moving significantly to the upside. The major reversal on the 3rd of August and the further climb to higher levels of the Crude price is explained by the recent production cuts announcements.
“The Joint Ministerial Monitoring Committee (JMMC) expressed its recognition and support for the efforts of the Kingdom of Saudi Arabia aimed at supporting the stability of the oil market and reiterated its appreciation for the Kingdom’s additional voluntary cut of 1 million barrels per day and for extending it for the month of September. The committee also acknowledged the Russian Federation for its additional voluntary reduction of exports by 300 kbd for the month of September.”
Source: https://www.opec.org/opec_web/en/press_room/7199.htm
Crude has retraced significantly from the recent upward movement, which was rapid enough. The volatility started to ease for now. It tested the 61.8 Fibo level and broke it, signalling a further drop.
XAUUSD (Gold) 4-Day Chart Summary
Server Time / Timezone EEST (UTC+03:00)
Price Movement
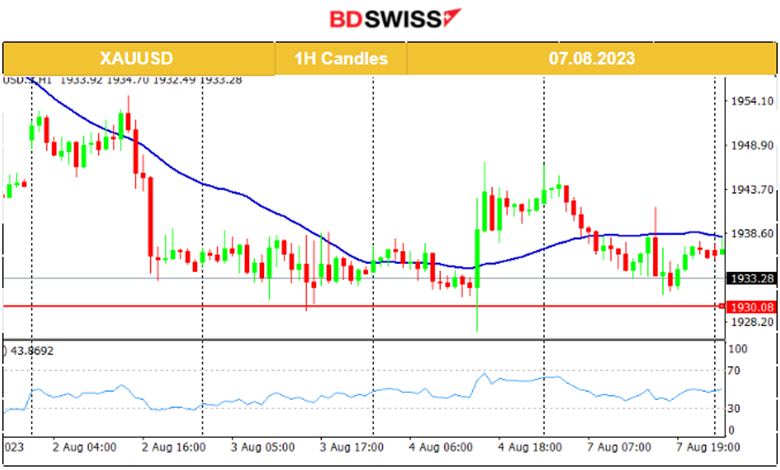
The price moved lower last week, breaking some further support but remaining above 1930 USD/oz. It was in a consolidation phase, in range as depicted by the horizontal red lines, since the market was waiting for the U.S. labour data to act. On the 4th of August, it eventually broke the resistance upwards and reached even 1947 USD/z as the USD suffered strong depreciation with the NFP release. Gold now keeps its path above the support near 1930.10 USD/oz. The question is, will it continue to test these support levels? The inflation-related data will have an impact on the USD this week and will probably determine its course.
______________________________________________________________
News Reports Monitor – Today Trading Day (08 Aug 2023)
Server Time / Timezone EEST (UTC+03:00)
- Midnight – Night Session (Asian)
No major news announcements and no major scheduled releases.
- Morning – Day Session (European)
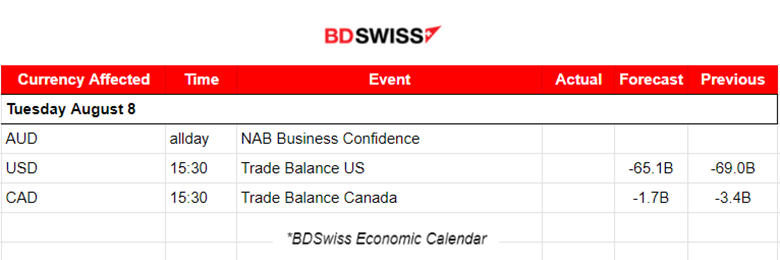
Trade Balance figures for the U.S. and Canada could generate more volatility than typical. However, no shocks are expected.
General Verdict:
______________________________________________________________


