 On Monday, March 25, 2024, there were two significant events that caught global attention. Firstly, the UN Security Council made a historic move by calling for an immediate ceasefire in Gaza. This decision marked a notable shift from the US’s previous stance, as it did not veto the measure, signaling a potential turning point in the conflict. It’s the first ceasefire call by the council since the war ignited in October, following numerous unsuccessful attempts to broker peace.
Meanwhile, on the same day, the cryptocurrency world witnessed a milestone as Bitcoin (BTC) bounced back above its all-time high price of $69,000 set in 2021. After experiencing a week-long correction period, BTC rallied, indicating renewed bullish sentiment among investors. This resurgence brought optimism to the crypto market and sparked discussions about the future trajectory of digital currencies.

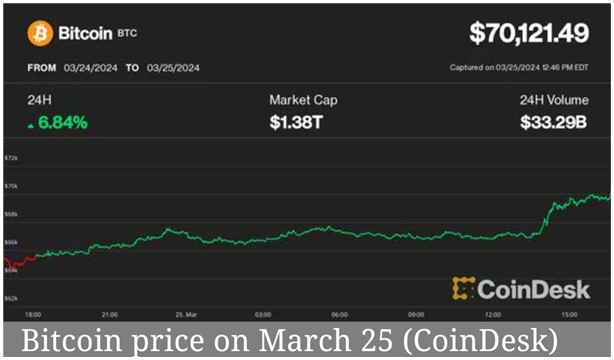
Bitcoin soared on Monday, March 25, 2024, kicking off the last week of March by reclaiming the $70,000 mark. Its price surged by 7.8%, reaching $70,995.48, and briefly hitting $71,239.31 as the stock market closed later in the day. This spike followed a correction period from it’s all-time high of $73,797.68 on March 14, where it dropped to around $60,800 on March 20. Alex Thorn from Galaxy Digital reassured investors, stating that such fluctuations are common in bull markets.
The cause of Monday’s surge wasn’t entirely clear, but March had seen bitcoin reaching new highs followed by healthy pullbacks, possibly due to investors pausing from selling bitcoin exchange-traded funds. Despite record outflows from GBTC over the past two weeks, possibly linked to Genesis and Gemini bankruptcy liquidations, technical indicators hinted at seller exhaustion. Additionally, the spike might be linked to recent Federal Reserve messaging. The Fed hinted at potential rate cuts and slowing down its quantitative tightening program, which could enhance liquidity conditions, positively impacting asset prices. Bitcoin, often seen as a liquidity barometer, responded favorably to this news.
Despite its fluctuations, bitcoin remained on track to end March positively, having gained 14% for the month and 66% for the first quarter, so far.

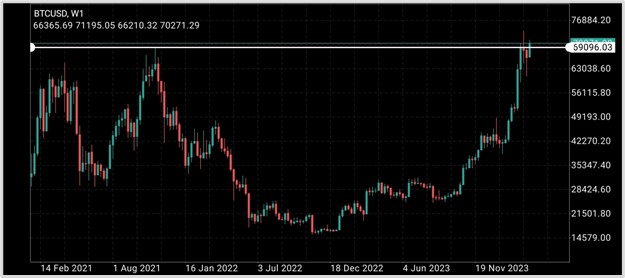
Looking at the Weekly Chart of BTCUSD from a technical analysis perspective, we observe that following the 2021 all-time high of $69,000, which acted as resistance, the price broke through to a new all-time high of $73,925. Subsequently, the price retraced and breached the initial resistance, now acting as a new support level. The price dropped further to $60,809 before breaking the 2021 all-time high again on Monday, March 25, 2024, reaching around $70,271. If the weekly chart closes above the 2021 all-time high price of $69,000, it suggests a likelihood of further upward movement. Conversely, if the weekly chart closes below $69,000, it indicates a higher probability of further downward movement.

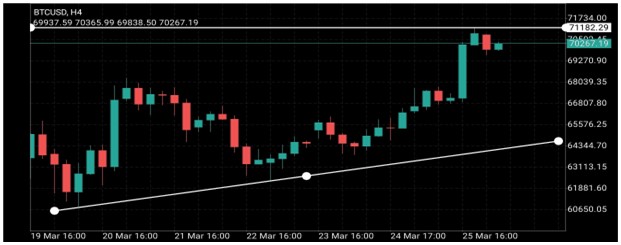
Analyzing the 4-hour chart of BTCUSD, we note that the price has been in an upward trend from $60,796.19, currently hovering around $70,267.19. An uptrend line drawn from the $60,796.19 price point rejected the price at $62,312.35 after a retracement from $68,291.01. Following the rejection, the price resumed its upward trajectory, reaching $71,182.29, the current resistance, before retracing to around $70,267.19.
If the uptrend line is breached, there is a higher likelihood of further downward movement. Conversely, if the uptrend line continues to reject the price, there is a higher probability of the price rising towards the current resistance. Breaking the resistance level would suggest an increased likelihood of further upward movement.
Sources :
https://www.bbc.com/news/world-middle-east-68658415
https://www.coindesk.com/markets/2024/03/25/bitcoin-pumps-above-69k-as-crypto-rally-resumes/amp/
https://www.cnbc.com/amp/2024/03/25/crypto-market-today.html
https://www.cnbc.com/2024/03/20/fed-meeting-march-2024-.html


