Previous Trading Day’s Events (04.03.2024)
______________________________________________________________________
Winners vs Losers
Metals climbed to the top of the list. Silver (XAGUSD) is leading for this week and month. 2.94% gains this week and 5.08% gains for the month. Gold (XAUUSD) follows with 3.66% gains so far this month.
 ______________________________________________________________________
News Reports Monitor – Previous Trading Day (04 Mar 2024)
Server Time / Timezone EEST (UTC+02:00)

- Midnight – Night Session (Asian)
No important announcements, no special scheduled releases.
- Morning – Day Session (European and N. American Session)
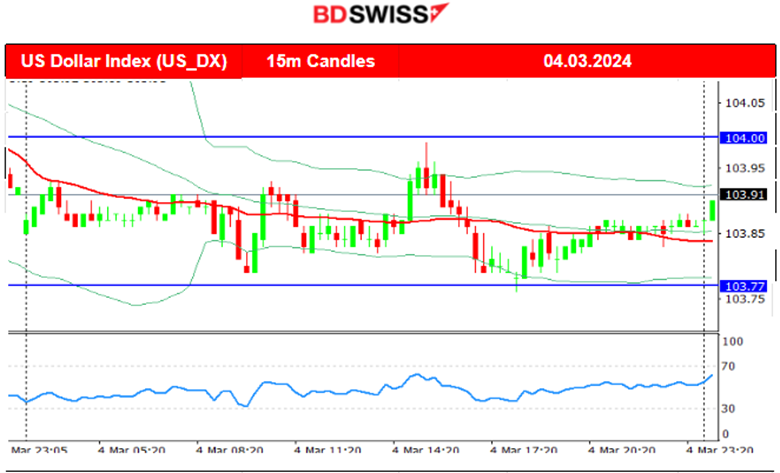
The Swiss consumer price index (CPI) increased by 0.6% in February 2024 compared with the previous month. Inflation was +1.2% compared with the same month of the previous year. CHF appreciated at the time of the release. USDCHF dropped nearly 25 pips and retracement followed.
General Verdict:
 __________________________________________________________________
FOREX MARKETS MONITOR
EURUSD (04.03.2024) 15m Chart Summary
Server Time / Timezone EEST (UTC+02:00)
Price Movement
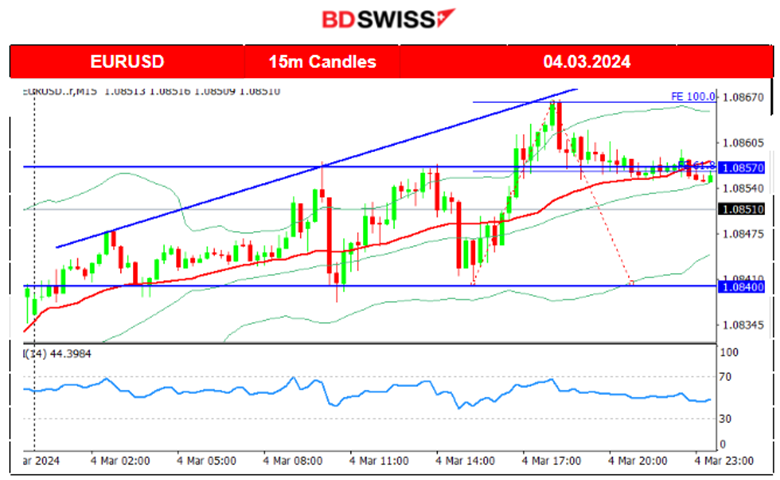
The pair closed higher for the trading day as the EUR was more positively affected in general. The dollar was barely affected or weakened so it was not the main driver. The ECB decision on rates is approaching and this affects the expectations and decisions for buying/selling EUR.
 ___________________________________________________________________
CRYPTO MARKETS MONITOR
BTCUSD (Bitcoin) Chart Summary
Server Time / Timezone EEST (UTC+02:00)
Price Movement
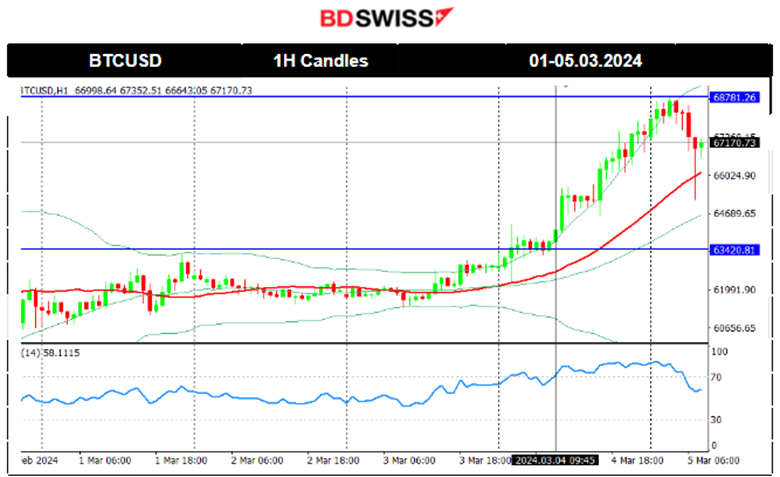
Bitcoin continues to the upside as it breaks more and more resistance. Remarkably, it even reached above 68K this morning. Investment firms like Grayscale, BlackRock and Fidelity, are pouring billions of dollars into buying the volatile digital asset.
Today we see a retracement back to the 30-period MA. Will this mean a halt in this crazy surge?
Source: https://www.bbc.com/news/technology-684345794
 Crypto sorted by Highest Market Cap:
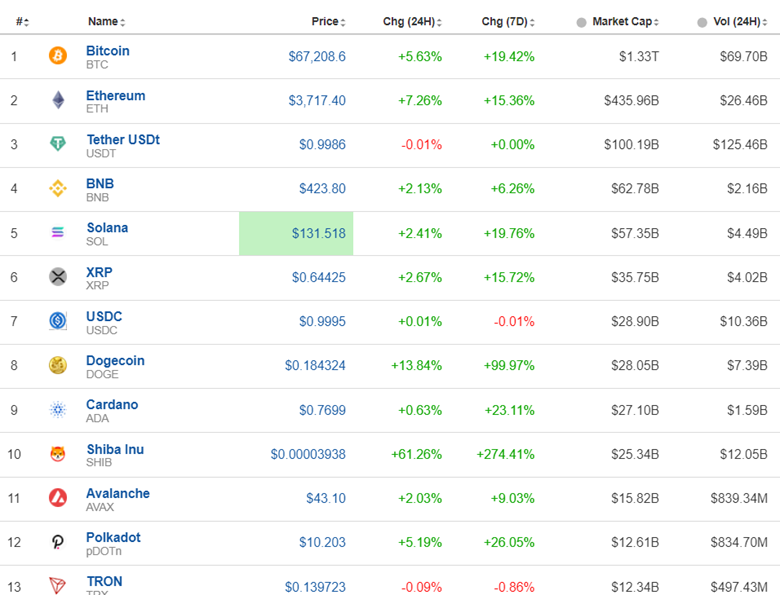
The crypto market exploded with performance. Shiba Inu reached 274% gains just in the last 7 days followed by Dogecoin with near 100% increase in the same period.
Source: https://www.investing.com/crypto/currencies
______________________________________________________________________
EQUITY MARKETS MONITOR
NAS100 (NDX) 4-Day Chart Summary
Server Time / Timezone EEST (UTC+02:00)
Price Movement
On the 29th Feb, all benchmark indices surged after the PCE report release showing a lower annual figure that caused the dollar to lose strength at that time. The momentum to the upside was strong enough to cause the index to move quite rapidly and further from the MA on its way up. Retracement followed today reaching the Fibo 61.8. A clear short-term uptrend. Yesterday 4th March the index retraced to the 30-period MA and today it crossed it on the way down showing signals that the uptrend is over for now.
 ______________________________________________________________________
COMMODITIES MARKETS MONITOR
USOIL (WTI) 4-Day Chart Summary
Server Time / Timezone EEST (UTC+02:00)
Price Movement
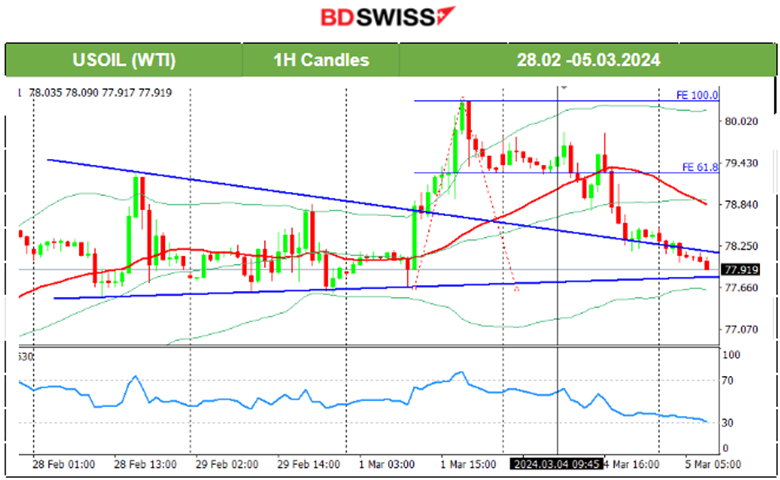
On the 1st of March, the price jumped high reaching the resistance at 80.3 USD/b before retracing back to 79.3 USD/b. On the 4th of March, it eventually reversed fully back to the support at near 77.9 USD/b. It looks like the particular support holds quite significance as it was tested many times. A breakout to the downside might lead Crude oil to lower levels too quickly.
 XAUUSD (Gold) 4-Day Chart Summary
Server Time / Timezone EEST (UTC+02:00)
Price Movement
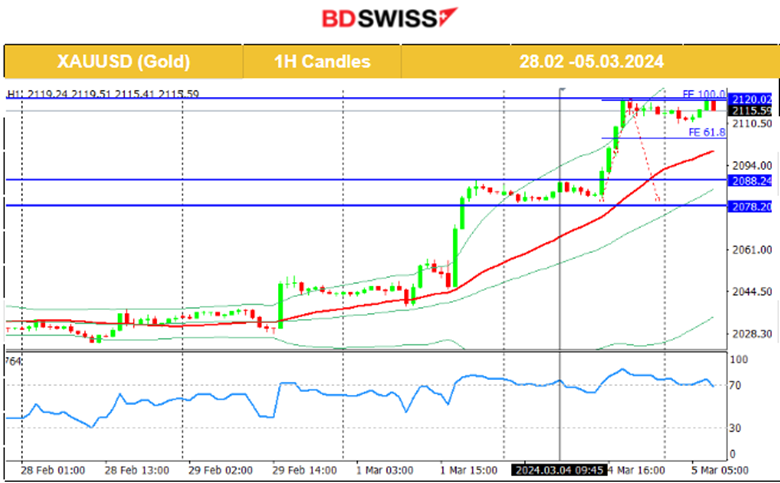
The 2088 USD/oz resistance eventually did not hold. The surge continued breaking the resistance and jumping more than 20 USD upwards as expected. Will this time Gold experience a significant retracement? Let’s see. Looking for signals is the best way to increase the probability that retracement will happen. As far as intraday analysis is concerned, the RSI does show bearish signals with those lower highs.
 ______________________________________________________________
News Reports Monitor – Today Trading Day (05 Mar 2024)
Server Time / Timezone EEST (UTC+02:00)
- Midnight – Night Session (Asian)
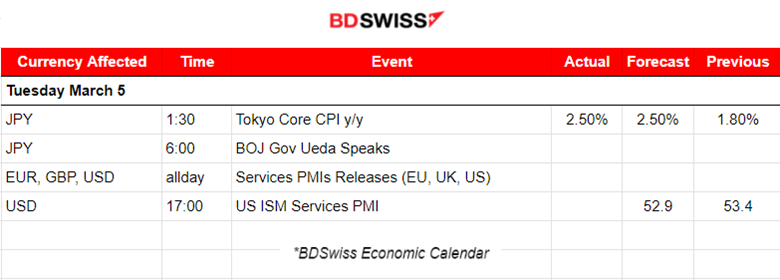
The Tokyo Core CPI figure was reported as expected. The annual inflation rate picked up from 1.6% to 2.6%. A low-level shock was recorded at that time at 1:30, with a sudden JPY depreciation, however the effect faded soon.
- Morning – Day Session (European and N. American Session)
Services PMIs releases on the same data will take place potentially increasing volatility levels. The ISM Services PMI will probably cause an intraday shock affecting USD It is in the expansion area. A surprise heavy drop could cause U.S. dollar appreciation.
General Verdict:
______________________________________________________________


