
 Q2 Earnings Release: Market Insights, Analyst Forecasts, and Technical Analysis")
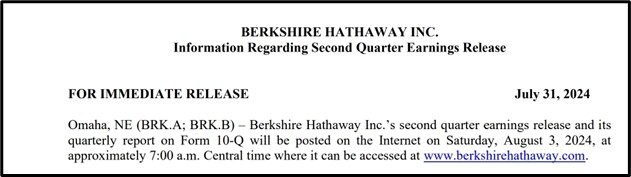 Berkshire Hathaway Inc. (BRK.A; BRK.B) announced in a press release on July 31, 2024, that it will publish its Q2 earnings report on August 3, 2024, around 7:00 a.m. Central Time.
Market Cap 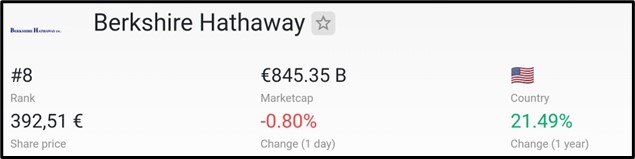 €845.35 billion is the current market cap of Berkshire Hathaway as of August 2024, ranking it as the 8th most valuable company globally by market capitalization, according to companiesmarketcap.com.
Dividend Information 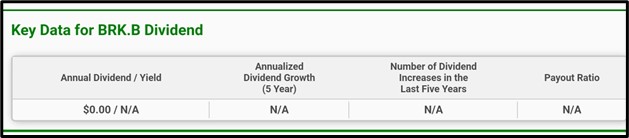 Berkshire Hathaway’s BRK.B stock currently has an annual dividend yield of $0.00, with no recorded growth in the past five years, no dividend increases, and an unavailable payout ratio.
Recent development at Berkshire Hathaway Inc
Here’s a recent update on developments at Berkshire Hathaway Inc. :
Berkshire Hathaway and Pilot Corporation finalize a settlement agreement.
Berkshire Hathaway acquires full ownership of Pilot Travel Centers LLC.
Q1 Earnings Report Recap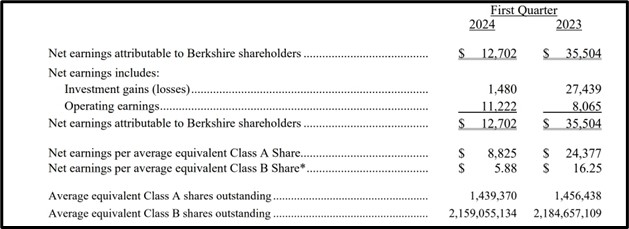
Net Earnings Decline: Berkshire Hathaway’s Q1 2024 net earnings fell to $12.7 billion from $35.5 billion in Q1 2023.
Investment Gains Drop: Investment gains significantly decreased to $1.48 billion from $27.44 billion.
Operating Earnings Increase: Operating earnings rose moderately to $11.22 billion from $8.07 billion.
EPS Decrease: Earnings per share for Class A and Class B shares decreased, with Class A dropping to $8,825 and Class B to $5.88.
Q2 Earnings Report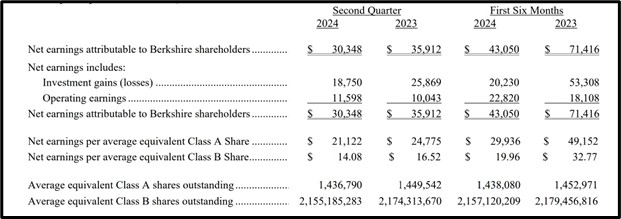
Net Earnings Decline: Q2 2024 net earnings fell to $30.35 billion from $35.91 billion in Q2 2023.
Investment Gains Drop: Investment gains decreased to $18.75 billion from $25.87 billion.
Operating Earnings Increase: Operating earnings rose to $11.60 billion from $10.04 billion.
First Half Earnings: Net earnings for the first half of 2024 decreased to $43.05 billion from $71.42 billion in the same period in 2023.
EPS Decline: EPS for Class A and Class B shares dropped to $29,936 and $19.96, respectively, compared to $49,152 and $32.77 in 2023.
Overall Trend: The data indicates a bearish trend, driven by lower investment returns and reduced share activity.
Technical Analysis 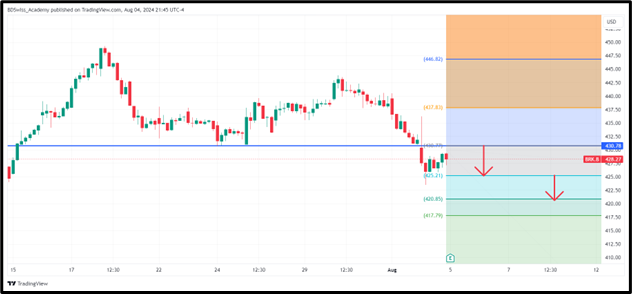
Bearish Breakout: Berkshire Hathaway Class B shares broke support at $430.78 on the 1-hour chart.
Downside Targets: If the breakout holds, expect price to drop to $425.21 and $420.85.
Breakout Failure: If the breakout fails, expect price to rise to $437.83 and $446.82.
Apply Risk Management
Conclusion
In conclusion, Berkshire Hathaway’s Q2 2024 performance mirrors the challenges faced in Q1, with a continued decline in net earnings and investment gains. Despite a slight increase in operating earnings, the overall bearish trend persists, reflecting in the company’s reduced EPS for both Class A and Class B shares.
Source :
https://www.berkshirehathaway.com/news/jul3124.pdf
https://companiesmarketcap.com/eur/berkshire-hathaway/marketcap/
https://www.zacks.com/stock/research/BRK.B/dividend-history
https://images.app.goo.gl/na3dDhDMgLyhBqy29
https://www.berkshirehathaway.com/news/jan0724.pdf
https://www.berkshirehathaway.com/news/jan1624.pdf
https://www.berkshirehathaway.com/news/may0424.pdf


