Previous Trading Day’s Events (16.05.2024)
There are signs that the economy slowed further early in the second quarter as the delayed effects of the Federal Reserve’s hefty interest rate hikes started to have a bigger impact.
April’s economic data, including nonfarm payrolls and retail sales, have so far come in below economists’ expectations.
“The economy is losing momentum in the face of restrictive monetary policy,” said Sal Guatieri, a senior economist at BMO Capital Markets. “But the jury remains out on how quickly inflation will subside to provide some rate relief.”
The PCE price indexes are the inflation measures tracked by the Fed for monetary policy. Goldman Sachs now expects the core PCE price index to have increased by 0.26% in April after rising 0.3% in March. It forecasts core inflation advancing 2.77% year-on-year, essentially matching March’s increase after rounding.
______________________________________________________________________
Winners vs Losers
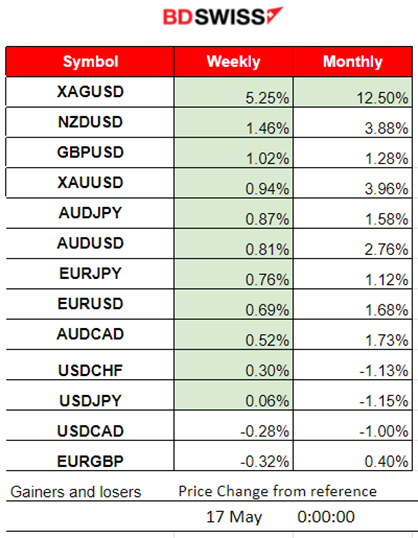
Silver is still on the top as the top gainer for the week and month with 5.25% and 12.50% gains so far respectively.
 ______________________________________________________________________
News Reports Monitor – Previous Trading Day (16.05.2024)
Server Time / Timezone EEST (UTC+03:00)
- Midnight – Night Session (Asian)
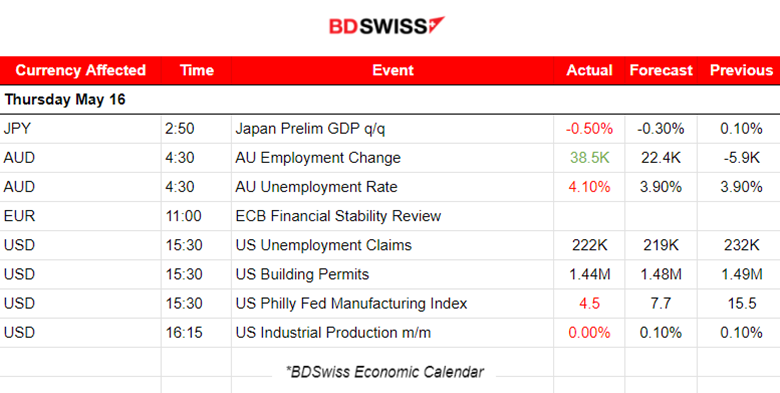
Labour market data for Australia were released at 4:30. Employment growth was reported 38,5K stronger than the consensus expectation. The unemployment rate though was reported higher by surprise at 4.10%. Obviously, mixed data here. The news caused the depreciation of the AUD and a drop of the AUDUSD pair to around 23 pips. Retracement eventually took place to the intraday mean.
- Morning – Day Session (European and N. American Session)
At 15:30 the jobless claims figure was reported lower but higher than expected, at 222K. The U.S. Labour market has shown signs of cooling with lower NFP figures and higher unemployment claims that seem to sustain high levels. The market’s initial reaction was USD depreciation at the time of the news release, however, the USD continued strengthening for the rest of the trading day. Philly Fed Manufacturing Index result was a miss 4.5 vs. 7.7 & 15.5 prior.
General Verdict:
 __________________________________________________________________
FOREX MARKETS MONITOR
EURUSD (16.05.2024) 15m Chart Summary
Server Time / Timezone EEST (UTC+03:00)
Price Movement
The pair moved early to the downside because the U.S. dollar started to appreciate early. The news at 15:30 barely moved the EURUSD upwards. The unemployment claims figure did not have a great impact. The pair moved steadily until it reached the support at near 1.08545 before retracing to the upside and back to the 30-period MA.
 AUDUSD (16.05.2024) 15m Chart Summary
Server Time / Timezone EEST (UTC+03:00)
Price Movement
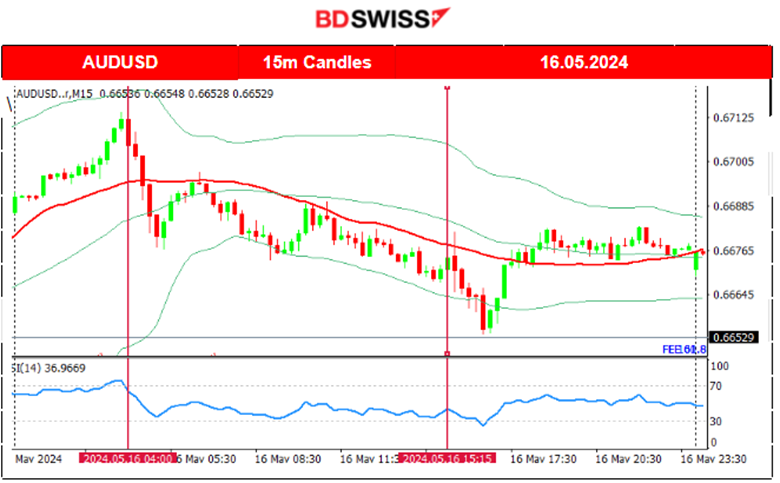
The pair moved early and aggressively upwards before the news. At the time of the Labour data release the AUD weakened despite the high employment figure because the unemployment rate had actually increased. The market gave more weight to the unemployment rate that was reported higher, causing AUD depreciation and bringing down the AUDUSD by near 35 pips. Retracement followed back to the MA. The rest of the path was mainly dollar-driven.
 ___________________________________________________________________
CRYPTO MARKETS MONITOR
BTCUSD (Bitcoin) Chart Summary 1H
Server Time / Timezone EEST (UTC+03:00)
Price Movement
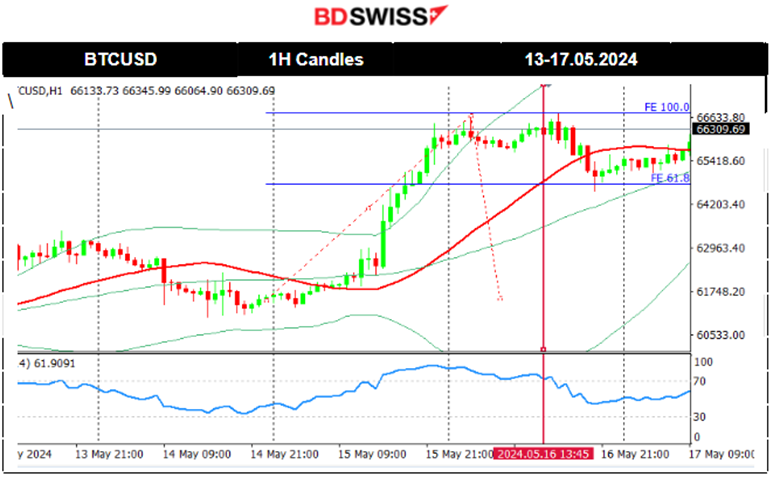
On the 14th of May, the price continued with a reversal to the downside, crossing the 30-period MA on its way down and reaching against the support area near the 61K USD before retracing eventually to the MA.
On the 15th of May, the U.S. CPI news triggered a jump in the Crypto to just over 66K and settled.
Bitcoin enthusiasts are now gaining confidence that Bitcoin is returning to the upside. The CPI news obviously triggered the jump. As mentioned yesterday in the analysis, retracement followed eventually with Bitcoin returning to the 61.8 Fibo level before again moving upwards, confirming the view that it might test more highs near 66,500 USD.
 Crypto sorted by Highest Market Cap:
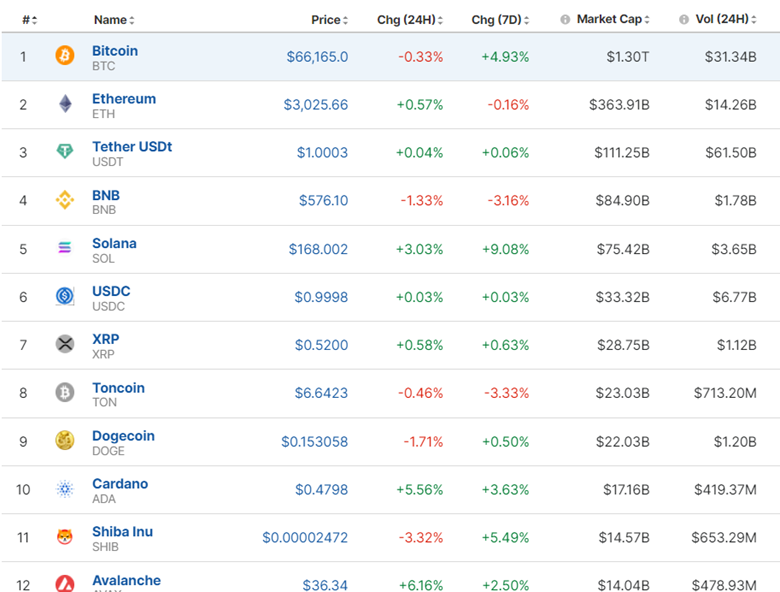
After the U.S. CPI report showed a slowdown in inflation, the Crypto market saw a boost. Gains were recorded overcoming the losses of last week.
Source: https://www.investing.com/crypto/currencies
______________________________________________________________________
EQUITY MARKETS MONITOR
S&P500 (SPX500) 4-Day Chart Summary
Server Time / Timezone EEST (UTC+03:00)
Price Movement
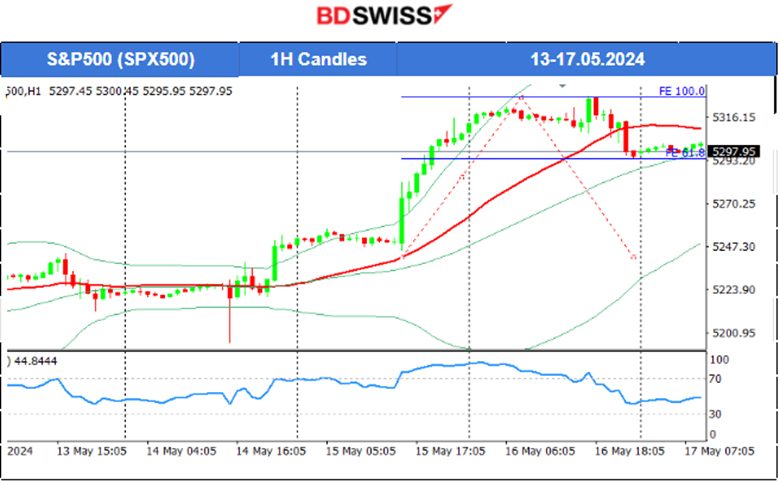
The PPI news on the 14th of May caused a breakout of the support near 5,211 USD causing the index to drop to 5,195 USD before it reversed immediately to the upside. This happened due to the dollar effect, we saw that the dollar index reversed immediately as well to the downside at that time. The level 5,240 USD was quite significant for resistance and that was broken on the 14th of May after the index’s continuation to the upside. The other indices experienced similar paths. On the 15th of May, the U.S. CPI report caused dollar depreciation and a jump in U.S. stocks. On the 16th of May, the index moved upwards again until it found strong resistance that marked the reversal to the downside. Dollar strengthening and not-so-interesting unemployment claims figures pushed the index to cross the 30-period MA and to settle at the 61.8 Fibo level.
 ______________________________________________________________________
COMMODITIES MARKETS MONITOR
USOIL (WTI) 4-Day Chart Summary
Server Time / Timezone EEST (UTC+03:00)
Price Movement
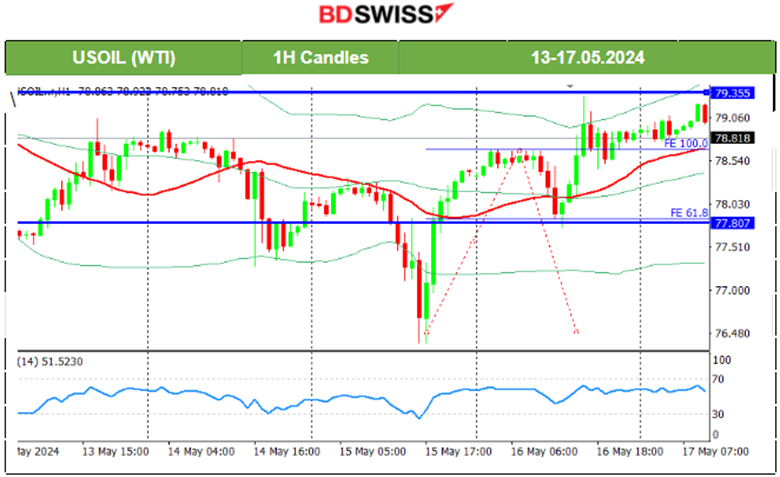
On the 14th of May, the PPI news caused its price to drop and test again the support at near 77.40 USD/b before it eventually retraced to the 30-period MA. On the 15th of May Crude oil broke the support at near 77.40 USD/b and moved lower near the support at 76.40 USD/b before it reversed to the upside. During the U.S. CPI news volatility levels grew with Crude oil to experience first a fall and then a full reversal. It crossed the 30-period MA moving rapidly to the resistance near 78.78 USD/b and a retracement took place as predicted in our previous analysis back to the 61.8 Fibo. After the news on the 16th of May, Crude oil started a steady path to the upside remaining above the MA.
 XAUUSD (Gold) 4-Day Chart Summary
Server Time / Timezone EEST (UTC+03:00)
Price Movement
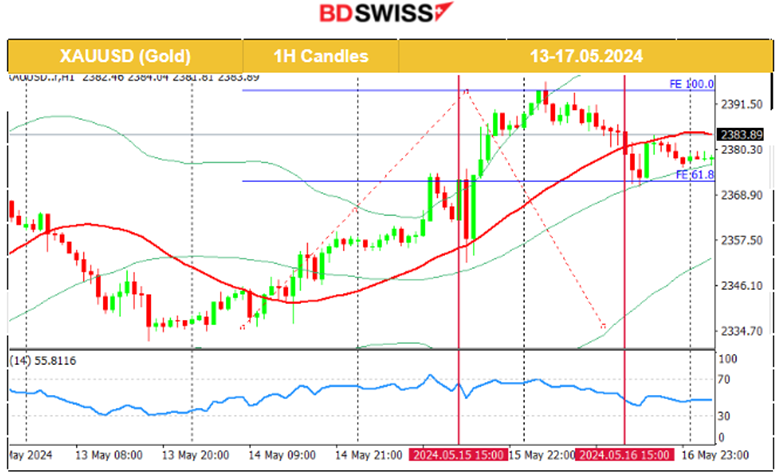
On the 14th of May, the support held and the price reversed to the upside correcting from the drop. Gold crossed the MA on its way up and moved higher to the resistance at 2,360 USD/oz. The dollar weakening helped gold to stay higher. After the release of the U.S. CPI news on the 15th of May, Gold jumped higher following the USD’s depreciation, reaching the resistance at near 2,397 USD/oz. Retracement followed as mentioned in our previous analysis, reaching 2,372 USD/oz.
The unemployment claims figures did not have much impact on the 16th of May. USD strengthening caused this drop in the price of Gold. After the retracement, it remained stable and close to the MA.
 ______________________________________________________________
News Reports Monitor – Today Trading Day (17 April 2024)
Server Time / Timezone EEST (UTC+03:00)
- Midnight – Night Session (Asian)
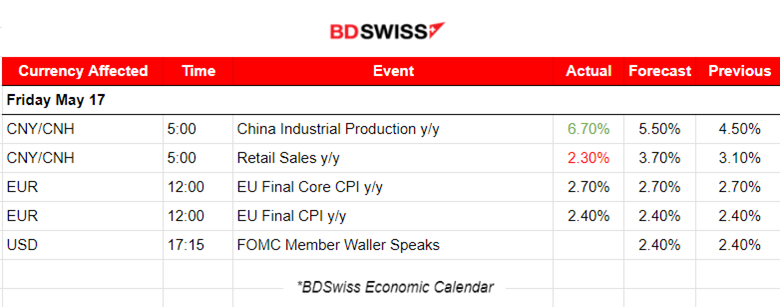
China experiences slower growth on the consumer side while industrial activity remains robust. Retail sales rose by 2.3% in April from a year ago, a less than the 3.8% increase forecast by a Reuters poll, and slower than the 3.1% pace reported in March. Industrial production rose by 6.7% in April from a year ago, beating expectations for 5.5% growth. AUD and CNH saw moderate depreciation after the news. AUDUSD dropped near 10 pips.
- Morning – Day Session (European and N. American Session)
The annual inflation rate in the Euro area was 2.4% in April 2024, stable compared to March 2024. A year earlier, the rate was 7.0%. In the EU, the annual inflation was 2.6% in April 2024, stable compared to March 2024. A year earlier, the rate was 8.1%. No market impact from the news. There are 2 versions of this report released about two weeks apart – Flash and Final. The Flash release, which the source first reported in April 2013, is the earliest and thus tends to have the most impact.
General Verdict:
______________________________________________________________


