

PREVIOUS TRADING DAY EVENTS – 27 Sep 2023
“While inflation and downward revisions to July data give a reality check to the report, strength everywhere else in the economy suggests third-quarter growth is on solid footing regardless of tepid equipment spending,” said Will Compernolle, macro strategist at FHN Financial in New York. “If nothing else, the resilience of business investment is one more reason the Fed can be cautiously optimistic that its rapid rate hikes have not tipped the economy into a recession.”
Durable goods inventories rose 0.2%, while unfilled orders increased 0.4%.
“Today’s estimates reinforce ongoing resilience in the manufacturing sector, reflecting restocking demand and what is shaping up to be another solid quarter for equipment investment,” said Jonathan Millar, senior economist at Barclays in New York.
Core capital goods shipments rebounded 0.7% after falling 0.3% in July. Shipments of nondefense capital goods soared 1.2%, reversing the prior month’s decline.
Source: https://www.reuters.com/markets/us/us-durable-goods-orders-unexpectedly-rise-august-2023-09-27/
______________________________________________________________________
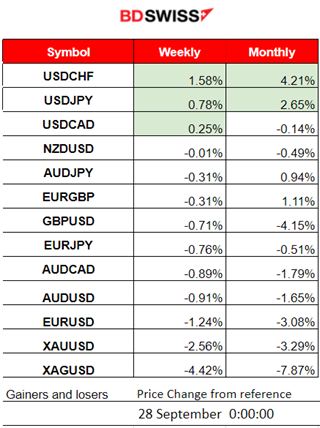
Winners vs Losers
USDCHF remains on the top of the week’s winners’ list having 1.58% gains followed by USDJPY which has 0.78%. USDCHF is leading this month as well remarkably with 4.21% gains.
______________________________________________________________________
News Reports Monitor – Previous Trading Day (27 Sep 2023)
Server Time / Timezone EEST (UTC+03:00)
- Midnight – Night Session (Asian)
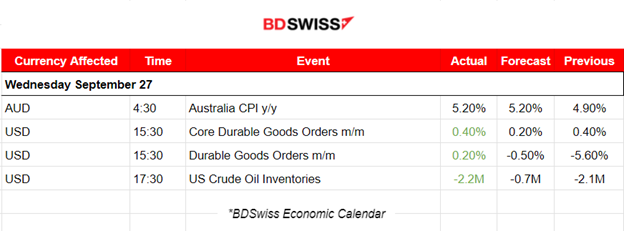
Australia’s monthly CPI indicator rose 5.2% in the twelve months to August, up from a rise of 4.9% in July, as expected. There was no shock and no increased volatility because of this release.
- Morning–Day Session (European and N. American Session)
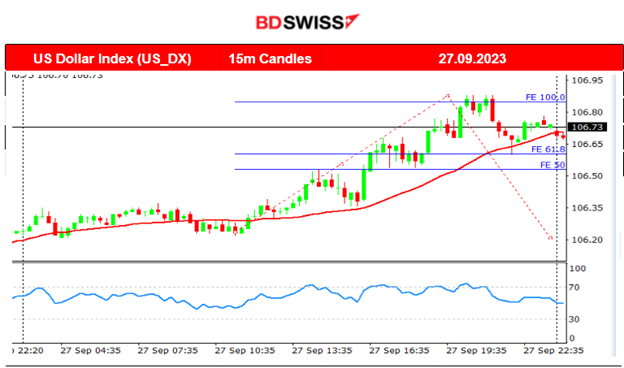
At 15:30 the durable goods orders figures were reported higher than expected, rising +0.2% in August vs. -0.5% expected. The Core ones also saw a rise as well. There was no shock observed at that time but the USD experienced a rather steady appreciation for a long period of time after that.
Crude oil inventories again reported a negative figure, -2M, more negative than expected. No significant reaction was observed in the markets since this indicator just explains some of the recent upward movement of the price of oil.
General Verdict:
____________________________________________________________________
FOREX MARKETS MONITOR
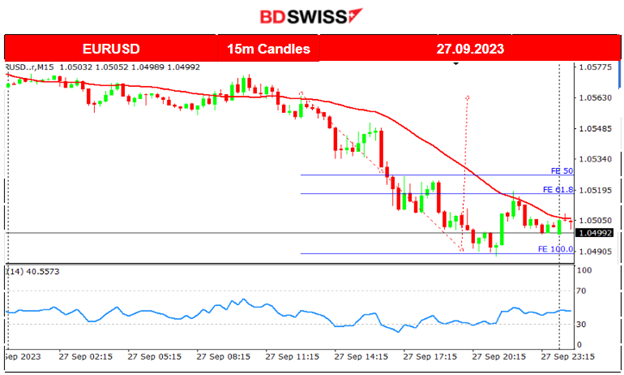
EURUSD (27.09.2023) Chart Summary
Server Time / Timezone EEST (UTC+03:00)
Price Movement
Since the pair’s path mirrors the DXY chart, it is clear that the USD is the main driver. Due to this reason, the EURUSD was steadily going downwards while the USD was appreciating slowly until the support was near 1.04905. After that support, it retraced finally back to the mean (30-period MA). The reports yesterday had no significant impact on the market, no shocks.
___________________________________________________________________
CRYPTO MARKETS MONITOR
BTCUSD (Bitcoin) 4-Day Chart Summary
Server Time / Timezone EEST (UTC+03:00)
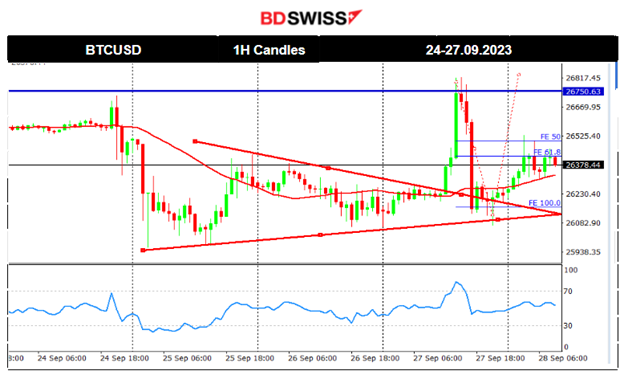
Price Movement
Bitcoin eventually broke the triangle formation after a shock took place on the 27th and moved upwards as expected rapidly. It found resistance at near 26750 and soon reversed fully back to the 30-period MA. The price of bitcoin was turned back alongside a renewed slide in the U.S. stock market. Interest rates are continuing to trend upward, putting pressure on the price of Bitcoin. U.S. 10-year Treasury yield rose to a new 16-year high of 4.63%.
The burst of volatility on the 27th initiated the first upward rapid move and the second. After the second downward movement, it retraced finally back to the 61.8 Fibo level when volatility started to experience lower levels.
Crypto sorted by Highest Market Cap:
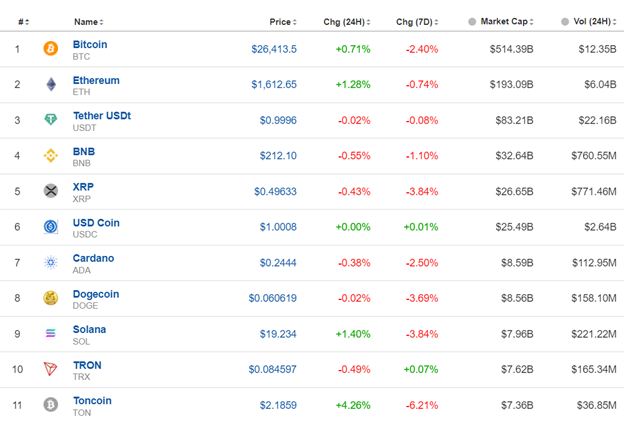
The 7-day column remains red since almost all crypto are facing pressure pushing them to the downside. Bitcoin and Ethereum remain resilient as prices retrace to the upside.
Source: https://www.investing.com/crypto/currencies
______________________________________________________________________
EQUITY MARKETS MONITOR
NAS100 (NDX) 4-Day Chart Summary
Server Time / Timezone EEST (UTC+03:00)
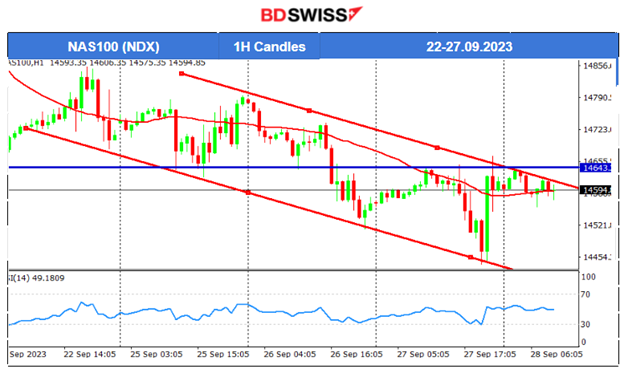
Price Movement
This week, a clear consolidation period took place for all benchmark indices that lasted until the 26th when finally the market moved to the downside after breaking the support. NAS100 broke that consolidation and went below the 14640 support level. It later found another support near 14520 before retracing back to the mean. The 14640 level acted as a resistance on the 27th eventually causing the index to reverse and slide even more to the downside reaching levels near 14440 before reversing fully.
______________________________________________________________________
COMMODITIES MARKETS MONITOR
USOIL (WTI) 4-Day Chart Summary
Server Time / Timezone EEST (UTC+03:00)
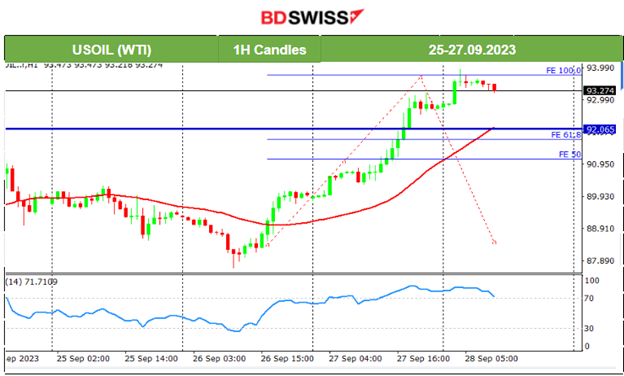
Price Movement
Crude’s rapid movement upward looks like a short-term shock and the chances for a retracement increase. A strong resistance has not yet been identified but there is a potential one. The 93.75 resistance could serve as the end of the shock upwards and soon a retracement could follow, near the level 92 USD/b.
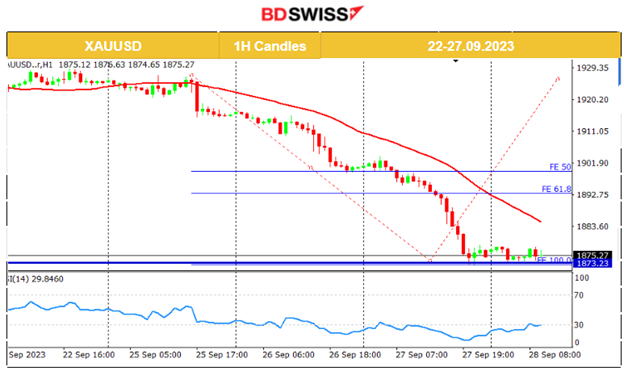
XAUUSD (Gold) 4-Day Chart Summary
Server Time / Timezone EEST (UTC+03:00)
Price Movement
Gold has been moving to the downside significantly. This is partly due to the USD strength. The Fed decided to keep interest rates unchanged and the market reacted by keeping the USD strong while Gold is seemingly no longer desirable. Rising expectations about future rate hikes are also playing their part. Currently, gold’s price has been breaking important support levels on its way down and is on a clear downward trend. It is now testing the support near 1873 USD/oz and that could serve as the end of this rapid downward trend. Could it be the case that next week Gold rises back to the 1900 USD/oz level? If we start to see signals of a bullish divergence and breakout of important resistance levels then it probably could. (The 4-Hour Chart seems to be more clear on this one).
______________________________________________________________
News Reports Monitor – Today Trading Day (28 Sep 2023)
Server Time / Timezone EEST (UTC+03:00)
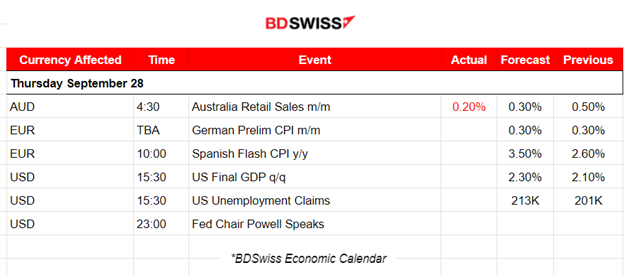
- Midnight – Night Session (Asian)
Australia’s monthly Retail Sales change figure was reported lower than expected at 0.20% vs. the previous 0.50%. No major shock was observed in the market.
- Morning–Day Session (European and N. American Session)
The monthly German Preliminary CPI change is going to be released later in the day. The yearly Spanish Flash CPI change will be reported also at 10:00, both important inflation figures for the Eurozone. Some unusual volatility could take place after the start of the European session affecting the EUR pairs.
At 15:30 a shock is expected to affect the USD pairs since the quarterly GDP and Unemployment claims report is released at that time. Finally, U.S. GDP is expected to be reported higher for the quarter. This coincides with the recent reports showing not-so-bad business conditions, unlike the other major economic regions. U.S. Unemployment claims remain close to 200K. A big surprise in figures could add even more to the volatility at the time of the release.
General Verdict:
______________________________________________________________


