Previous Trading Day’s Events (15.08.2024)
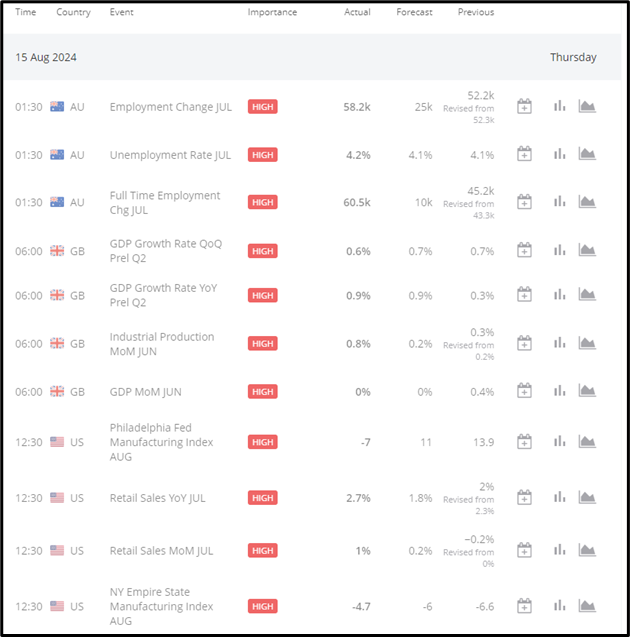
Australia Unemployment Rate: July 2024 at 4.2%, highest since January 2022.
Unemployed rose by 23.9K to 637.1K.
UK Monthly GDP MoM: August 2024 flat, after 0.4% growth in July. Services are down 0.1%, and industrial production is up 0.8%.
US Retail Sales: July 2024 up 1% MoM, the largest rise since January 2023. Notable gains in motor vehicles (+3.6%) and electronics (+1.6%).
US Initial Jobless Claims: Fell by 7K to 227K in the week ending August 10th, the second consecutive weekly decline
Winners Vs Losers In The Forex Market
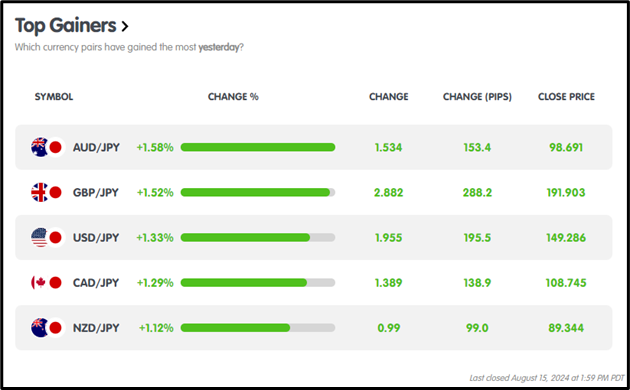
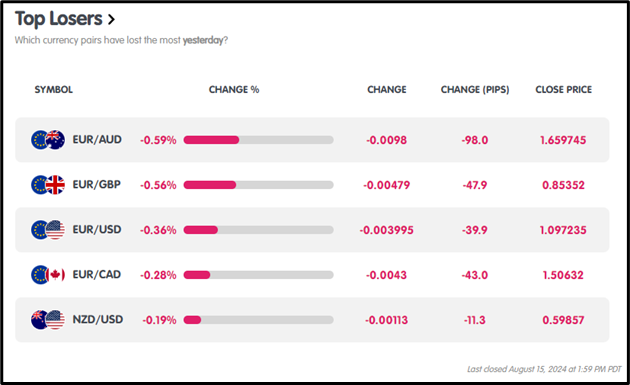
Yesterday, August 15, 2024, in the Forex market, AUD/JPY surged as the top performer with a +1.58% gain and 153.4 pips, while EUR/AUD led the declines, losing -0.59% and dropping 98.0 pips.
News Reports Monitor – Previous Trading Day (15.08.2024)
Server Time / Timezone EEST (UTC+03:00)
Tokyo Session:
Australia Unemployment Rate at 4.2%, up 23.9K to 637.1K; Bullish spike post-release at 1:30 am GMT.
London Session:
UK Monthly GDP MoM flat; Services -0.1%, Industrial Production +0.8%; Bullish response at 6 am GMT.
New York Session:
US retail sales +1% MoM, the largest rise since January 2023; motor vehicles +3.6%, electronics +1.6%; and bullish surge at 12:30 pm GMT.
US Initial Jobless Claims -7K to 227K; Second weekly drop; Bullish spike at 12:30 pm GMT.
General Verdict:
Market sentiment was broadly bullish across sessions due to positive economic data.
FOREX MARKETS MONITOR
EURUSD (15.08.2024) 15m Chart Summary
Server Time / Timezone EEST (UTC+03:00)
Price Movements
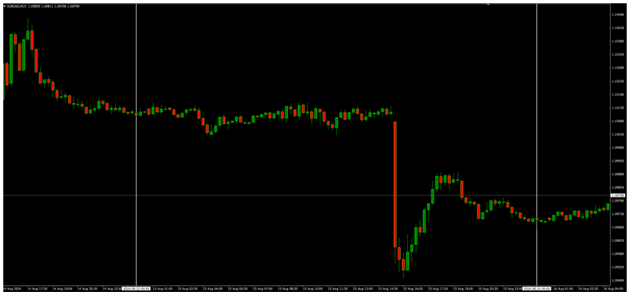
EURUSD showed a bearish trend, opening at 1.10103 and closing lower at 1.09707, with the day’s high at 1.10142 and the low at 1.09484.
CRYPTO MARKETS MONITOR
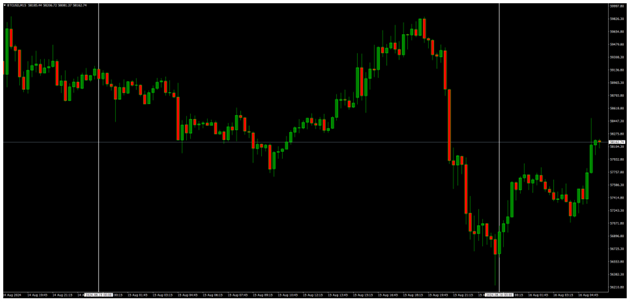
BTCUSD (15.08.2024) 15m Chart Summary
Server Time / Timezone EEST (UTC+03:00)
Price Movements
BTCUSD showed a bearish trend, opening at $59,193.22, and closing at $56,633.78, with a daily low of $56,197.28 and a high of $59,847.96.
STOCKS MARKETS MONITOR
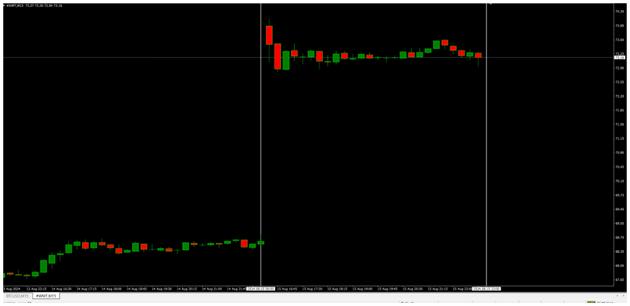
Walmart Inc. (15.08.2024) 15m Chart Summary
Server Time / Timezone EEST (UTC+03:00)
Price Movements
Walmart Inc. (NYSE: WMT) exhibited a bearish trend, opening at $74.13 (+7.9%) above the prior close of $68.64, and closing at $73.18, showing a gain over the previous close. The stock reached an intraday high of $74.44 and a low of $72.77.
INDICES MARKETS MONITOR
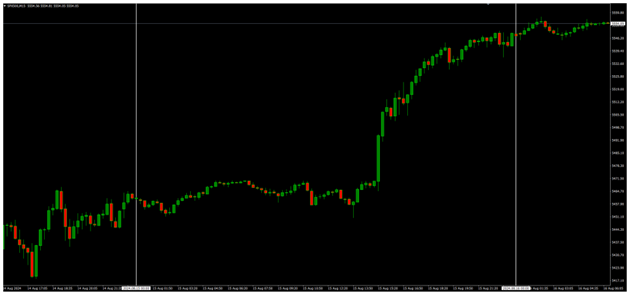
S&P 500 (15.08.2024) 15m Chart Summary
Server Time / Timezone EEST (UTC+03:00)
Price Movements
The S&P 500 experienced a bullish trend, opening at $5460.29 and closing at $5547.26. During the trading session, it reached a high of $5547.37 and a low of $5449.86.
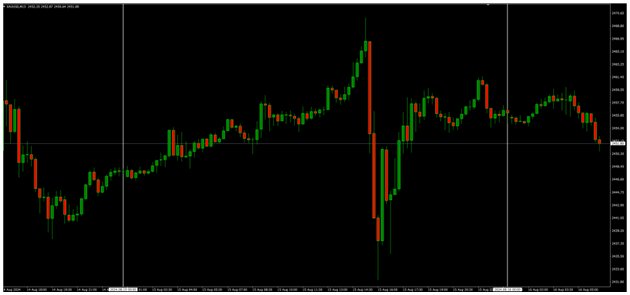
XAUUSD (15.08.2024) 15m Chart Summary
Server Time / Timezone EEST (UTC+03:00)
Price Movements
XAUUSD exhibited a bullish trend, commencing at $2446.76 and concluding at $2456.54. During the session, it reached an intraday peak of $2470.03 and a trough of $2431.90.
News Reports Monitor – Today Trading Day (16.08.2024)
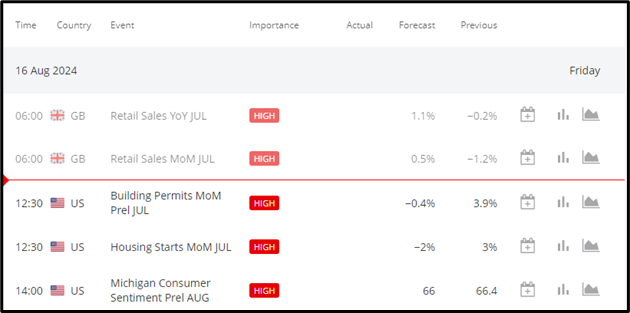
Tokyo Session:
No high-impact events were reported.
London Session:
UK Retail Sales YoY (July): Forecast at 1.1%. A lower-than-expected figure could weaken the GBP.
UK Retail Sales MoM (July): Forecast at 0.5%. A lower-than-expected figure could also weaken the GBP.
New York Session:
US Building Permits MoM (July): Forecast at -0.4%. A lower-than-expected figure might weaken the USD.
US Housing Starts MoM (July): Forecast at -2%. A lower-than-expected figure could lead to a weaker USD.
US Michigan Consumer Sentiment (Prelim August): Forecast at 66. A lower-than-expected figure could weaken the USD.
General Verdict:
Expect volatility as UK Retail Sales may drive GBP, while key US data could pressure the USD. London and New York sessions hold trading opportunities.
Sources :
https://km.bdswiss.com/economic-calendar/
Metatrader 4


