Previous Trading Day’s Events (29.05.2024)
The Australian (CPI) rose at an annual pace of 3.6% in April, up from 3.5% in March and above market forecasts of 3.4%. Moreover, a closely watched measure of core inflation, the trimmed mean, also accelerated to an annual 4.1%, from 4.0%. The CPI excluding volatile items and holiday travel stayed at an annual 4.1%.
The RBA expects headline inflation to pick up to 3.8% by June this year, but the hope is that the new relief from the government – including billions in electricity rebates and rent subsidies – would help ease the cost-of-living pressures in the second half.
The RBA has raised interest rates by 425 basis points since May 2022 to a 12-year top of 4.35% but steadied its hand for four straight meetings since its last hike in November as cautious consumers scaled back their spending and the economy slowed to a crawl.
Source: https://www.reuters.com/markets/australia-consumer-inflation-surprises-high-side-april-2024-05-29/
______________________________________________________________________
Winners vs Losers
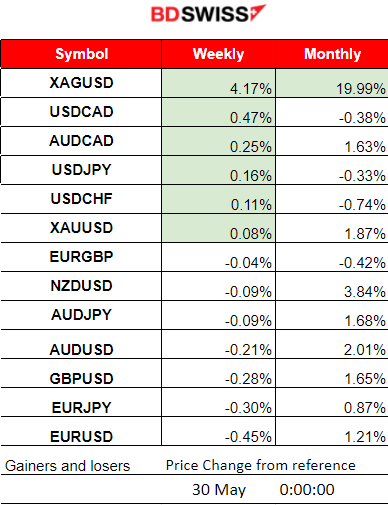
Silver remains put, at the top of the winner’s list having 4.17% gains this week and nearly 20% gains this month. The dollar is strengthening significantly and most pairs (USD as the base are reaching the top).
 ______________________________________________________________________
News Reports Monitor – Previous Trading Day (29.05.2024)
Server Time / Timezone EEST (UTC+03:00)

- Midnight – Night Session (Asian)
Australia’s Inflation was reported to be higher than expected and shook the market as it turned away from the target level. The RBA is likely to delay rate cuts and maintain a tightening bias. Upon release of the 3.60% figure the AUD appreciated heavily and an intraday moderate shock took place. AUDUSD jumped near 15 pips before reversing eventually to the intraday mean.
- Morning – Day Session (European and N. American Session)
The released flash estimate of German inflation in May signals sticky prices in the entire eurozone. Headline inflation came in at 2.4% year-on-year, up from the 2.2% YoY in April but still below the 2.5% YoY recorded in February. The European inflation measure came in at 2.8% YoY from 2.4% in April. The EUR started to depreciate after the news since on a month-to-month basis the figure was reported at 0.1%, lower than expected.
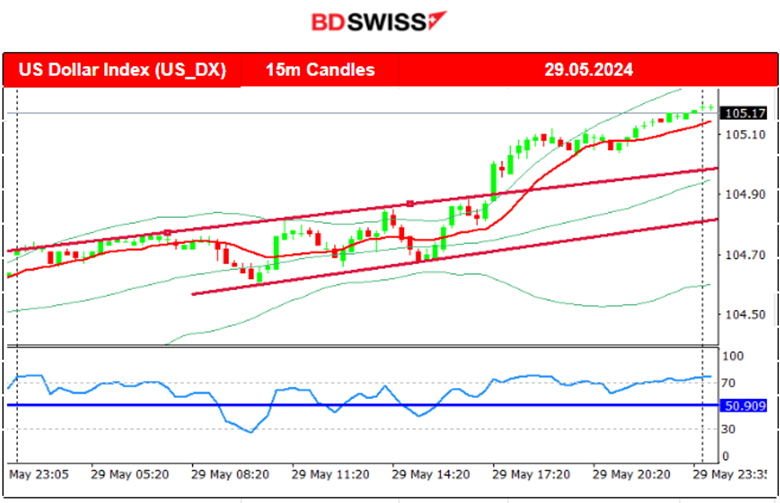
The Richmond Manufacturing Index showed improvement, turning from negative to 0. The U.S. dollar started to appreciate significantly after the news.
General Verdict:
 __________________________________________________________________
FOREX MARKETS MONITOR
EURUSD (29.05.2024) 15m Chart Summary
Server Time / Timezone EEST (UTC+03:00)
Price Movement
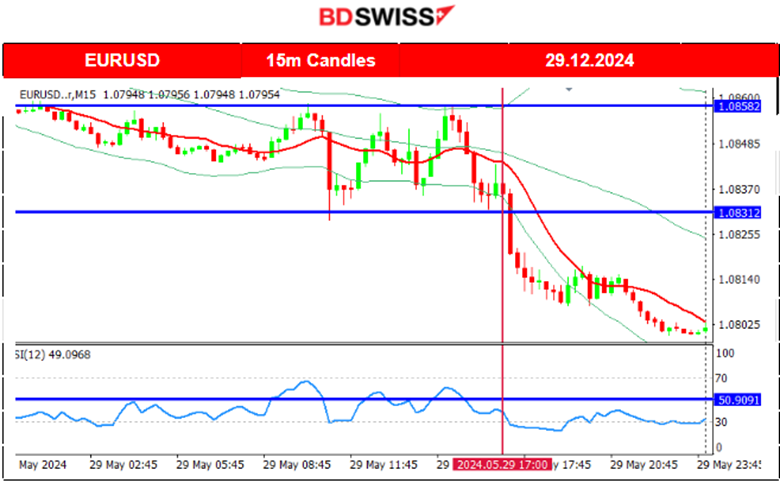
The pair was moving sideways with low volatility until the start of the European session when volatility increased and news for German inflation caused a slight weakening of the EUR. However, the pair continued with the movement around the 30-period MA before 17:00. After that time, the release of the Richmond Manufacturing Index figure caused the dollar to appreciate and the pair to start dropping and moving downwards until the end of the trading day.
 ___________________________________________________________________
CRYPTO MARKETS MONITOR
BTCUSD (Bitcoin) Chart Summary 1H
Server Time / Timezone EEST (UTC+03:00)
Price Movement
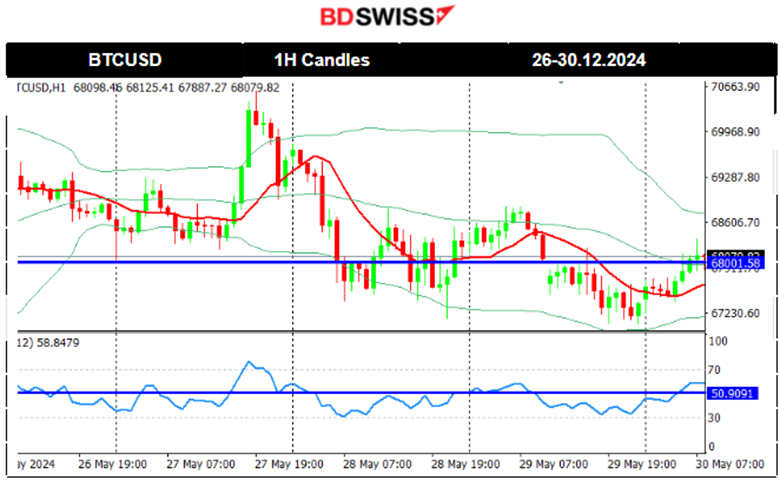
Bitcoin settled near 70K USD on the 22nd of May. That changed later with Bitcoin moving rapidly to the downside on the 23rd after 16:00. Many assets including stocks and commodities got affected negatively after that time. The price returned back and settled near the 67K USD level wiping out the gains since the jump on the 20th of May.
The price eventually jumped on the 24th of May and continued its upward movement until the resistance at near 69,600 USD. It retraced during the weekend when volatility levels lowered.
After a period of consolidation during the weekend when the price experienced low volatility, Bitcoin saw a jump on the 27th of May reaching 70,6K but soon reversed heavily to the downside. After finding support at near 67,500 USD it retraced to the 30-period MA and remained close, settling near the 68K USD level.
 Crypto sorted by Highest Market Cap:
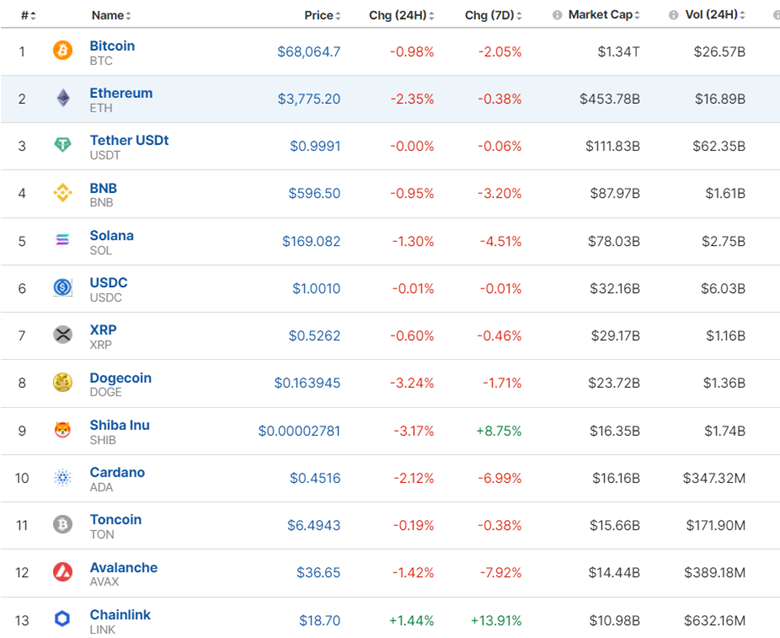
The market got a boost from the approval of ETH ETFs by the SEC. However, on the 27th it saw a notable retreat. Currently, there is no movement in the market and prices remain low. For the last 7 days, most crypto on the list saw losses.
Sources:
https://www.investing.com/crypto/currencies
______________________________________________________________________
EQUITY MARKETS MONITOR
S&P500 (SPX500) 4-Day Chart Summary
Server Time / Timezone EEST (UTC+03:00)
Price Movement
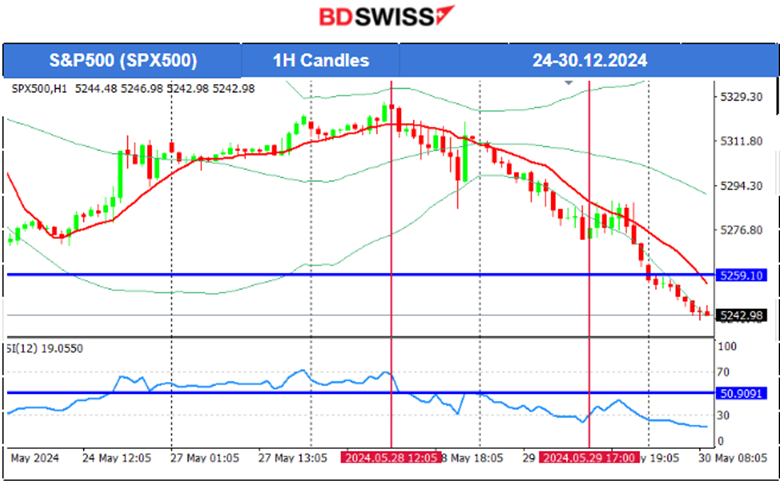
PMI figures all indices dropped heavily on the 23rd of May. S&P500 reached support at near 5,258 USD before a strong retracement took place with an upward steady movement on the 24th of May. The index reached the 5,314 USD resistance that day before it retraced to the 61.8 Fibo level. On the 27th of May, it was a holiday in the U.S. and the stock market was closed. Indices did not experience much volatility, S&5P500 moved however slightly higher forming an upward wedge. The wedge was broken on the 28th and the index moved lower to the support around 5,280 USD before reversing to the 30-period MA. A downward path continued on the 29th of May and is currently on the 30th with no signs of slowdown. 5,200 is a probable target level and the mean of a 50-period Bollinger Band indicator on the Daily chart.
 ______________________________________________________________________
COMMODITIES MARKETS MONITOR
USOIL (WTI) 4-Day Chart Summary
Server Time / Timezone EEST (UTC+03:00)
Price Movement
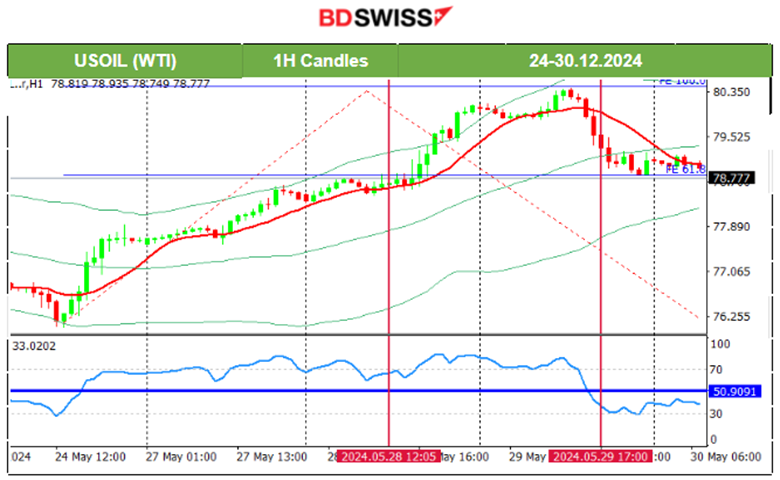
On the 24th that support was at nearly 76 USD/b. After that, the price reversed to the upside, crossing the MA on its way up and reaching the resistance at near 77.90 USD/b. The RSI did not show strong bearish signals and retracement did not take place. The price instead continued to move upwards aggressively. A huge reversal took place with the price passing 80 USD/b on the 29th. Using technical and a slowdown indicator we identified that a retracement will take place as mentioned in our previous analysis. Retracement was completed the same day returning to the 78.8 USD/b.
 XAUUSD (Gold) 4-Day Chart Summary
Server Time / Timezone EEST (UTC+03:00)
Price Movement
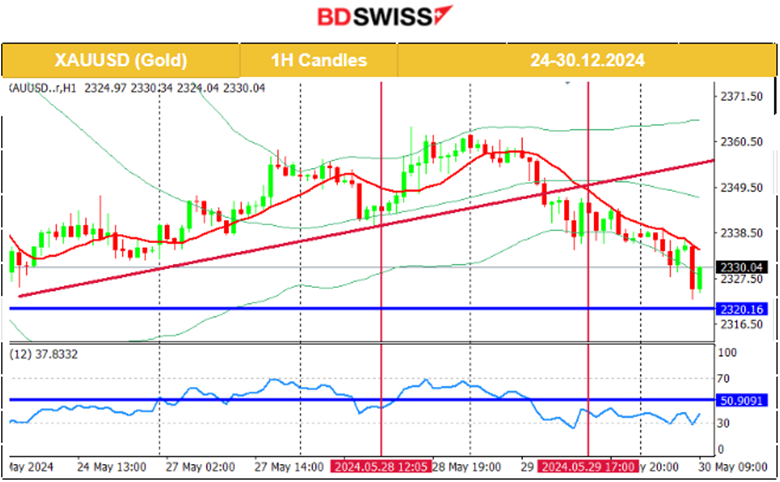
On the 24th of May, the price moved only slightly upwards but the potential for a further upward movement still remained as mentioned in our previous analysis. The price moved to the upside and completed the retracement to the 61.8 Fibo level and reached near the target of 2,360 USD/oz on the 27th of May. After finding resistance close to that level the price seems, on the 29th of May, to turn to the downside upon channel breakout as depicted on the chart. On the 30th of May, it continues still to the downside and could test the 2,320 USD/oz.
 ______________________________________________________________
News Reports Monitor – Today Trading Day (30 May 2024)
Server Time / Timezone EEST (UTC+03:00)

- Midnight – Night Session (Asian)
No important announcements, no special scheduled releases.
- Morning – Day Session (European and N. American Session)
The quarterly Swiss GDP figure will be released potentially affecting the CHF pairs at 10:00.
The quarterly U.S. GDP preliminary figure will be released at 15:30, shedding some light on whether the economy slowed in the second quarter. This is what is expected with a figure of 1.3% versus the previous 1.60%. USD pairs could be affected by a moderate intraday shock at that time. Unemployment claims will be reported at that time as well and they are expected to show slight growth. However, the impact will probably not be so great.
General Verdict:
______________________________________________________________


