Previous Trading Day’s Events (18.04.2024)
Source:
https://finance.yahoo.com/news/australia-march-employment-unexpectedly-falls-014147419.html
______________________________________________________________________
Winners vs Losers
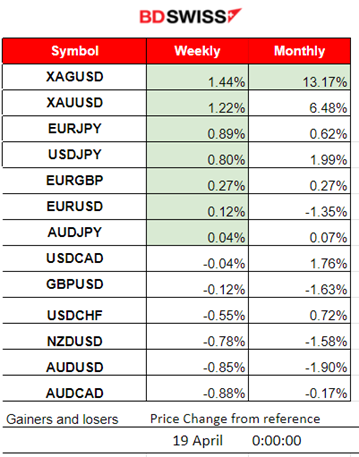
Silver remains on the top of the winner’s list for the week with 1.44% and Gold follows with 1.22% gains. This month finds Silver at the top still with 13.17% gains so far.
 ______________________________________________________________________
News Reports Monitor – Previous Trading Day (18.04.2024)
Server Time / Timezone EEST (UTC+03:00)
- Midnight – Night Session (Asian)
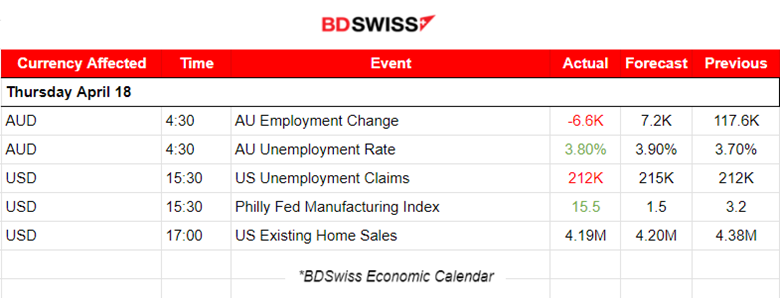
According to the employment data for Australia, employment dropped more than expected and the unemployment rate jumped to 3.8% from 3.7%. The market reacted with AUD depreciation but the impact was moderate. The AUDUSD dropped just 10 pips.
- Morning – Day Session (European and N. American Session)
At 15:30 the U.S. Unemployment Claims figure was released and it was not far off from the standard figures the market is experiencing lately as mentioned in our previous analysis. Claims were reported lower coinciding with the recent strong labour market data. An improvement in the Philly Manufacturing Index had a positive impact on the dollar. In general, the dollar saw a strengthening yesterday overall.
General Verdict:
 __________________________________________________________________
FOREX MARKETS MONITOR
EURUSD (18.04.2024) 15m Chart Summary
Server Time / Timezone EEST (UTC+03:00)
Price Movement
EURUSD was driven mainly by the USD. The pair moved early to the upside as the USD started early with weakening but later after finding resistance at 1.069, it reversed to the downside. The USD started to experience strengthening, bringing the pair to the downside, sharply at first, and more steadily after a retracement took place. Overall the USD strengthened causing the pair to close the trading day lower. The news had no special impact on the path, however, it had only some role to play in the USD’s strengthening.
 ___________________________________________________________________
CRYPTO MARKETS MONITOR
BTCUSD (Bitcoin) Chart Summary 1H
Server Time / Timezone EEST (UTC+02:00)
Price Movement
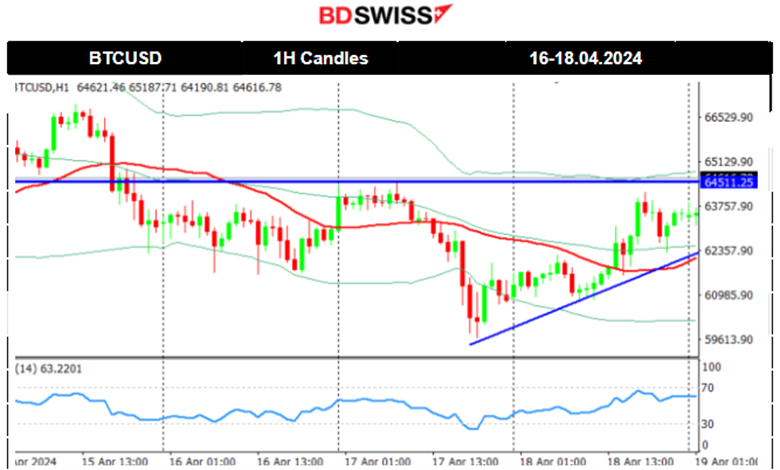
Bitcoin saw a drop from 71K USD in the last few days and was moving below the 30-period MA. On Saturday, April 13th, Iran launched a drone attack on Israel and Bitcoin’s price dropped sharply reaching just below the 62K USD support. Volatility remained high and after Bitcoin’s price reversed to the upside passing the 30-period MA on its way up it signalled the end of the downside movement and the start of a sideways but volatile path. It managed to break the 62K USD support on the 17th of April, reaching support at near 60K USD. On the 18th of April, the price moved to the upside, crossing the MA on its way up and testing again the resistance near 64,500 USD.
 Crypto sorted by Highest Market Cap:
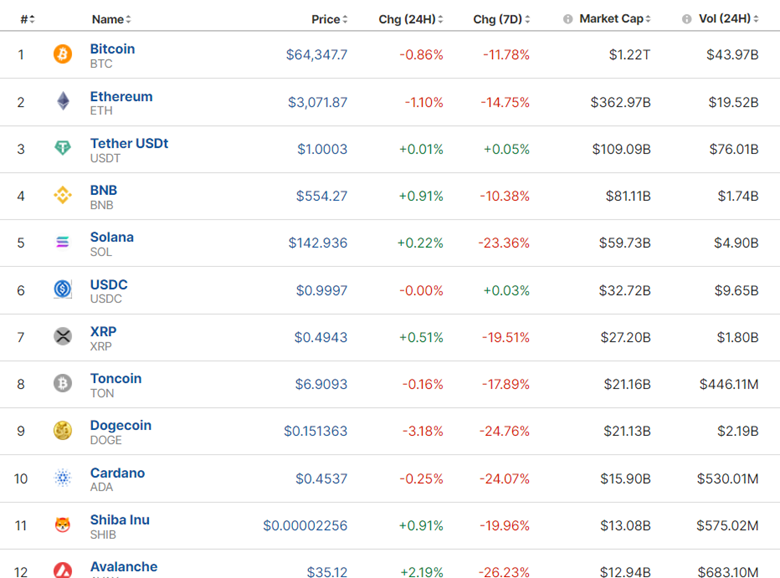
The market seems to have improved a bit. The next halving is projected to take place tomorrow April 19th-20th 2024. Historically, halving events have been associated with increases in Bitcoin’s price. This might be the turning point this market needs.
Source: https://www.investing.com/crypto/currencies
https://www.reuters.com/markets/currencies/crypto-fans-count-down-bitcoins-halving-2024-04-19/
______________________________________________________________________
EQUITY MARKETS MONITOR
S&P500 (SPX500) 4-Day Chart Summary
Server Time / Timezone EEST (UTC+03:00)
Price Movement
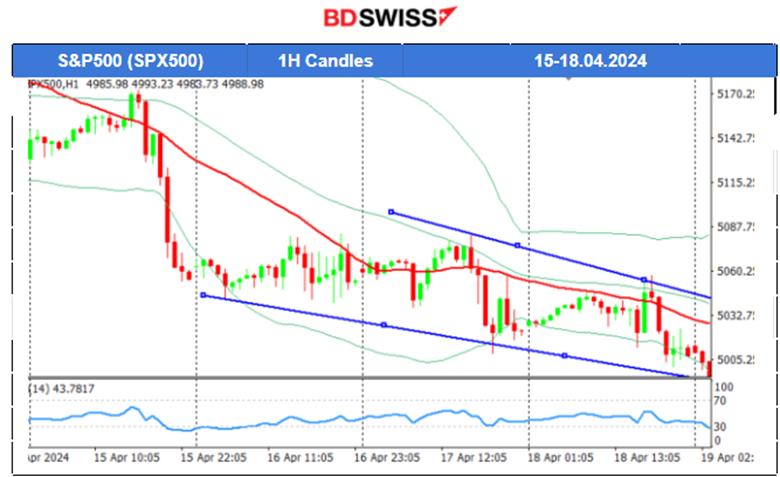
On the 12th of April, volatility continued being high and the index suffered a huge drop breaking the support at 5,135 USD, reaching the next level at 5,100 USD before eventually retracing to the 30-period MA. On the 15th of April, it was when stocks plunged after the exchange opened and the index moved lower. After a period of consolidation, on the 17th of April, it broke the support at 5,040 USD and moved lower to the next support at 5,000 USD before retracing. On the 18th of April, the market remained below the 30-period MA but a breakout did not occur. The breakout of the 5,000 USD level eventually caused a sharp drop on the 19th of April as mentioned in our previous analysis.
 ______________________________________________________________________
COMMODITIES MARKETS MONITOR
USOIL (WTI) 4-Day Chart Summary
Server Time / Timezone EEST (UTC+02:00)
Price Movement
Following Iran’s weekend attack on Israel, the price actually dropped, flirting with the 84.3 USD/b. Its breakout occurred on the 15th of April, and as mentioned in our previous analysis, the breakout caused a significant drop reaching the support of around 83.5 USD/b. The price recovered eventually with a full reversal, crossing the 30-period MA on the way up reaching 85.5 USD/b. It retraced from that level and currently remains close to the MA. Since the 16th of April, the market has shown that volatility lowers and this was the cause of a triangle formation to appear. A breakout occurred on the 17th of April eventually causing the drop of the price to 82 USD/b. On the 18th of April, the price broke the support end and reached the next support at 81 USD/b before retracement took place.
 XAUUSD (Gold) 4-Day Chart Summary
Server Time / Timezone EEST (UTC+03:00)
Price Movement
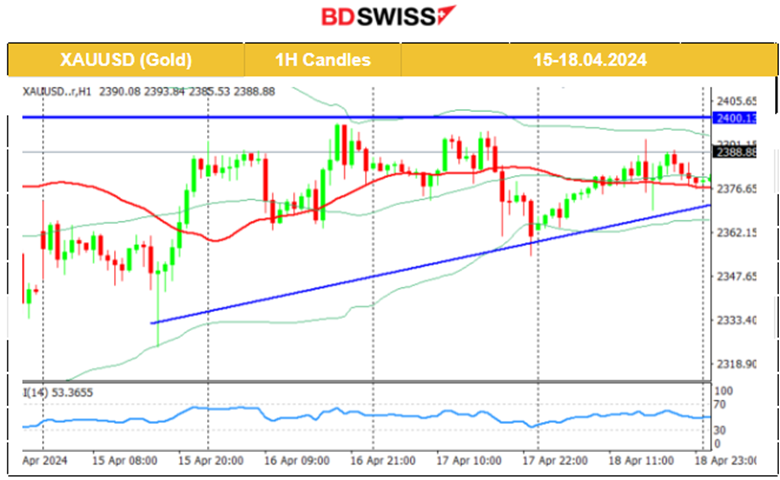
On the 15th of April, the market opened with a gap to the upside. Despite the dollar strengthening due to better-than-expected retail sales data, Gold kept its resilience and picked up momentum, moving to the upside again. The 2,400 USD remains a strong resistance level. On the 17th of April Gold moved lower as it broke the apparent upward wedge formation reaching the intraday support at 2,355 USD/oz before returning to the 30-period MA. On the 18th of April, Gold stayed in range, flirting with the 2,390 USD/oz at some point but remaining close to the MA.
 ______________________________________________________________
News Reports Monitor – Today Trading Day (19 April 2024)
Server Time / Timezone EEST (UTC+03:00)

- Midnight – Night Session (Asian)
Israel launched an attack on Iran, US officials said. US officials said overnight that an Israeli missile struck Iran in the city of Isfahan in central Iran while Iranian media also reported explosions.
Source:
https://uk.news.yahoo.com/live/iran-israel-attack-missile-live-news-war-064111345.html
Many asset categories were affected including commodities.
- Morning – Day Session (European and N. American Session)
At 9:00 the monthly retail sales report of the U.K. showed that Retail sales volumes (quantity bought) were estimated to be flat (0.0%) in March 2024, following an increase of 0.1% in February 2024 (revised from 0.0%). The market reacted with GBP appreciation during that time and the effect has not faded yet.
General Verdict:
______________________________________________________________


