Rates as of 05:00 GMT
Market Recap
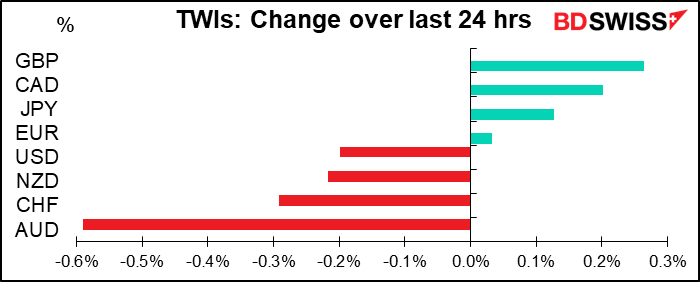
It’s hard to classify today’s moves as “risk-on” or “risk-off” or “risky” or whatever. The growth-sensitive AUD was the #1 loser but the safe-haven CHF was the #2. I think probably the main impetus was just position-cutting ahead of the long holiday weekend (both Friday and Monday are holidays in many centers).
AUD had been declining ever since shortly after the US market opened Wednesday. It took a sudden lurch down at 05:45 GMT this morning for no apparent reason. There were several economic indicators out that were negative for the Australian economy, but they were all released well before that. I can only assume that people were closing out their positions ahead of the long weekend and some stops were triggered.
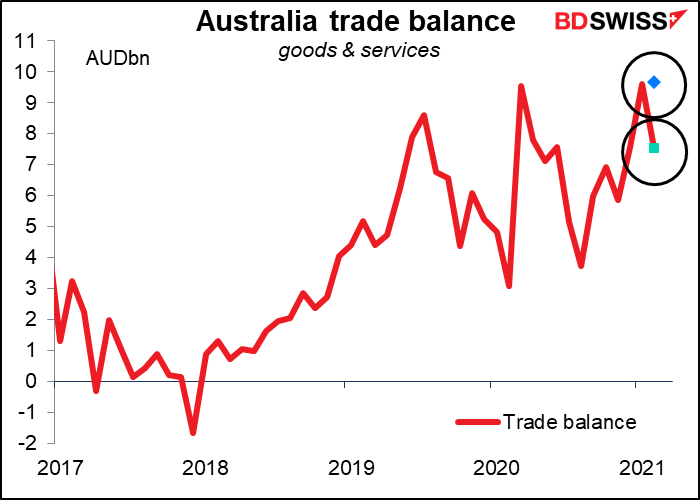
Australia’s trade surplus was lower than expected as exports fell instead of rising as expected (-1.3% mom vs +1.5% expected) and imports rose faster than expected (+5.2% mom vs +3.6% expected).
And Australian home loans fell instead of rising as expected and job vacancies rose less than expected too. Having said that, those two are relatively low-impact indicators; meanwhile, the closely watched retail sales were revised up.
Also the Caixin China manufacturing purchasing managers’ index (PMI) missed estimates completely – it fell to 50.6 from 50.9 instead of rising to 51.4 as expected.
CAD was the second-best-performing currency but it has turned around and started weakening this morning after a Canadian news service reported that the province of Ontario, home of the capital Ottawa and the country’s most populous province, will return to lockdown on Saturday for 28 days.
Japan’s tankan beat all around – every major diffusion index (DI) was better than expected. Yet the TOPIX index was up only 0.10% — hardly significant. Of particular note, the large manufacturers’ DI, the most important one, rose to +5 from -10 – it was expected to be -1. This is the first time in six quarters that it’s been positive and indeed is better than it was before the pandemic started (it was zero in Q4 2019). The large non-manufacturers’ index rose to -1 from -5 – it had been expected to creep up only to -4. And capital spending was revised up to +3.0% vs expectations that it would be revised down to -1.4% from -1.2%. That’s a good sign that companies anticipate stronger demand in the future.
The main point yesterday was of course President Biden’s announcement of his infrastructure plan. I’ve discussed that at some length already and the details weren’t that different from what we had expected, so I won’t bother rehashing it. The modest gains in the stock market – S&P 500 up 0.4% and NASDAQ +1.5% — suggest that it didn’t have much in the way of surprises. Nonetheless, US Treasury yields rose, with 10-year yields rising +3.8bps to 1.740%, their highest closing level in over a year.
Inflation expectations were responsible for the rise as 10-year breakevens climbed +2.7 bps to 2.37%. As a result, real yields saw only a modest rise of +0.8 bps.
It was a different story for both stocks and bonds on the other side of the Atlantic, though. There the key story is the resumption of lockdown measures as virus cases start to climb again. French President Macron announced a four-week nationwide lockdown of schools and businesses. Italy, which instituted new restrictions on three-quarters of the country on March 15th, extended those restrictions through April. (The BBC has a good roundup of European lockdown measures if you’re interested.)
The result was a modest fall in bond yields in Europe (10yr bunds -0.5 bps, OATs -0.3 bps and BTPs -1.2bps) and weak stock markets (Euro Stoxx 50 -0.2%, DAX -0.3%).
I’ve been bearish USD for some time but it’s clear that the differing growth outlook for the US vs Europe is weighing on EUR. With the US pumping in fiscal support of almost $4tn and more to come while Europe dithers and dallies while shutting down, it’s likely that the difference in growth between the two regions will only widen. The market is now forecasting that the US will return to pre-pandemic levels of output in Q2 this year, while that’s not expected to happen in the Eurozone until Q2 next year. And these forecasts probably don’t take into account the full impact of the Biden Administration’s plans.

Part of the reason of course is that many US states are willing to make the trade-off between health and economic activity. Health policy in the US is set at the state level, not the national level, and many states run by Republicans prioritize the economy over people’s health. As a result lockdown measures in the US are loosening even as the pandemic there worsens as well. (The Economist had a great article about the impact of the virus in South Dakota, a state that’s notorious for its lax virus prevention measures. The unemployment rate is 3.1%, as low as it was before the pandemic, while the state has had the 8th highest number of deaths relative to population.)

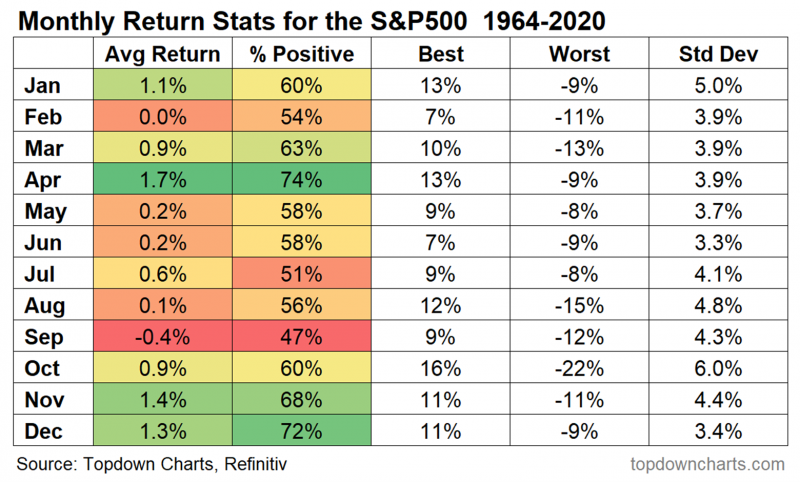
It’s April Fool’s Day today. But April is no fool; on the contrary, on average it’s the best-performing month for the US stock market. But with the S&P 500 closing yesterday just short of a record high and at one point during trading yesterday hitting its highest-ever intraday level of 3,994 — just short of an amazing 4,000 — just remember two points: a) past performance is no guarantee of future performance, and b) the average is no guarantee of the specific
Following yesterday’s meeting of the OPEC countries, today they meet with their outside partners (mostly Russia) in the so-called “OPEC+” group. After the Joint Monitoring Committee of technical experts Tuesday lowered their demand forecast by 1mn barrels a day (b/d) for the next three months, the larger group is expected to maintain the current output reductions and keep production unchanged for at least another month. That might shore up oil prices, which fell yesterday. I think this decision is widely expected, but since there’s always some doubt – Russia and the UAE reportedly want to increase production — a decision to keep output stable would remove that doubt and be positive for the price.
The risk is asymmetric though. I think a decision to increase production would be more of a surprise and would send the price down more than a decision to hold output steady would send prices up.
Today’s market
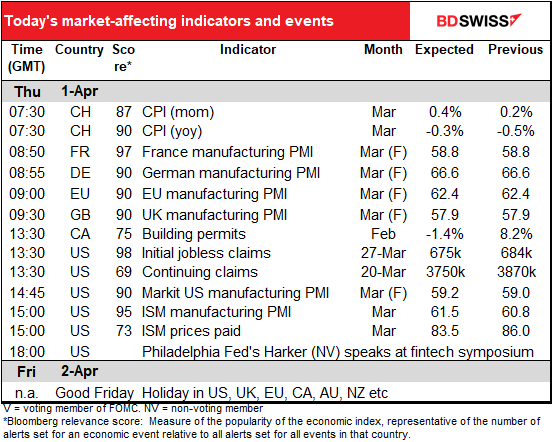
Note: The table above is updated before publication with the latest consensus forecasts. However, the text & charts are prepared ahead of time. Therefore there can be discrepancies between the forecasts given in the table above and in the text & charts.
The day starts with the final manufacturing purchasing managers’ indices (PMIs) for those countries that announced preliminary ones and first-and-only ones for those without preliminary ones. The forecasts for the ones that have preliminaries are just the preliminary PMIs themselves – no one bothers forecasting the revisions. We will be watching to see if the surprising improvement that we saw in the major economies is spreading to the rest of the world as well.
Attention will then turn to the weekly US jobless claims. After last week’s larger-than-expected -97k decline in claims, economists expect some mean reversion and only -9k. This would be almost exactly the average weekly decline so far this year (-8k). At that average rate it will take another year (50 weeks) to get back to where jobless claims were before the pandemic hit.
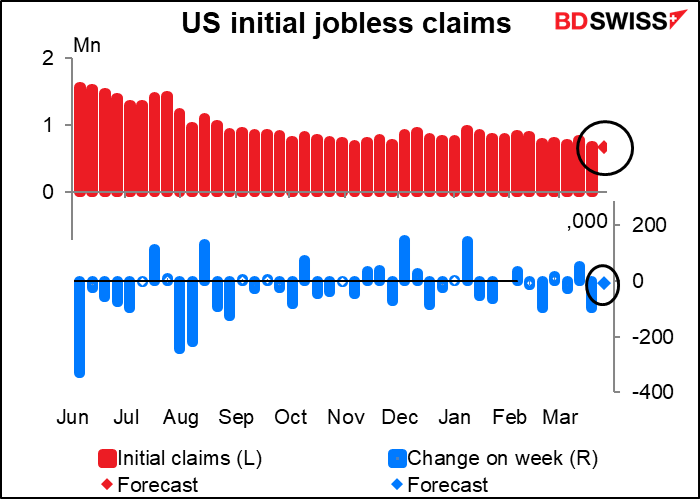
Continuing claims are expected to fall by -120k, not as good as last week’s -264k but a bit better than this year’s average of -109k. (Yes I know that technically, saying “falling by -120k” means rising by 120k since it looks like I’m subtracting a negative number, but I just want to keep it clear that I’m talking about the number falling, not rising.)

The US Institute of Supply Management (ISM) manufacturing PMI is expected to rise further to 61.5. This is in contrast to the Markit version of the same index, which peaked back in January.
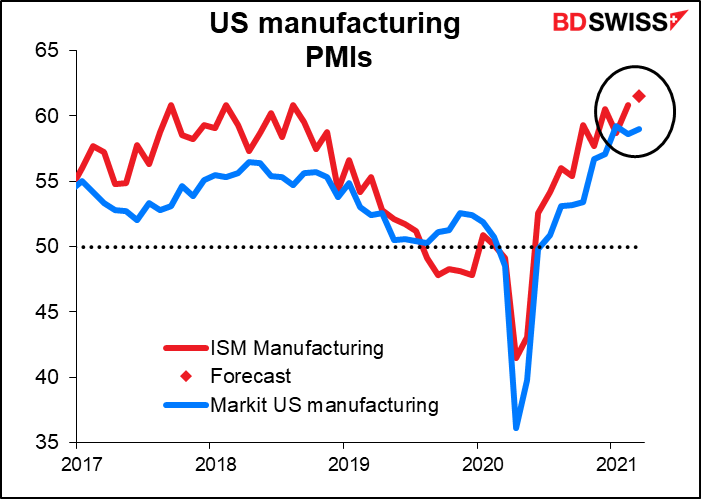
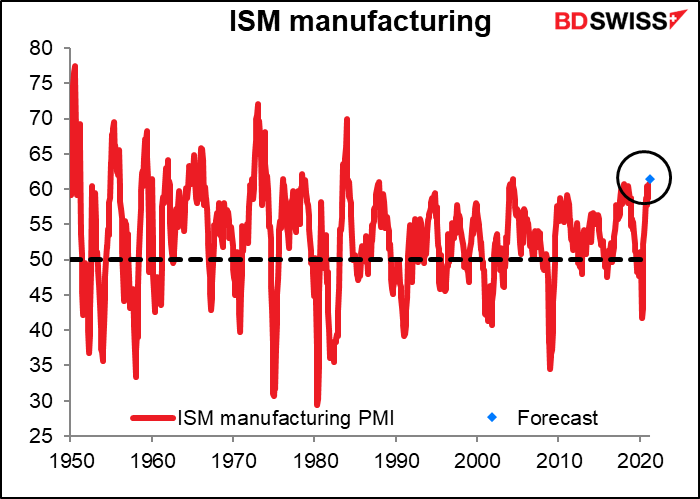
If this forecast comes true, it would be astonishing – the highest this index has been since December 1983. (A little history lesson: the Fed jacked the fed funds rate up to 20% back in 1980 and again in 1981, sending the US into a deep recession. By 1983 they had lowered it down to the-then relatively low level of 8.5% and the economy was taking off again. They even had to raise the rate a bit in 1983.) Of course, the PMIs don’t say anything about the amount of business, just how many firms see business improving as opposed to those seeing business get worse (or staying the same). If business is terrible one month and then not so terrible the next month, the index will be above the 50 line signaling expansion even if the absolute level of business isn’t so great. Still, the index has been above 50 since last June, so business has been improving for quite some time.
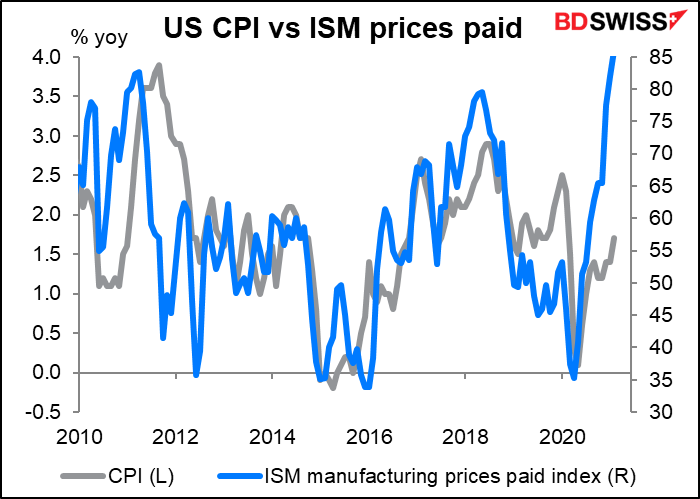
People will also be watching the prices paid PMI. It’s expected to come down slightly, but remain at an unusually high level. This is one of the things that’s encouraging higher inflation expectations in the US…
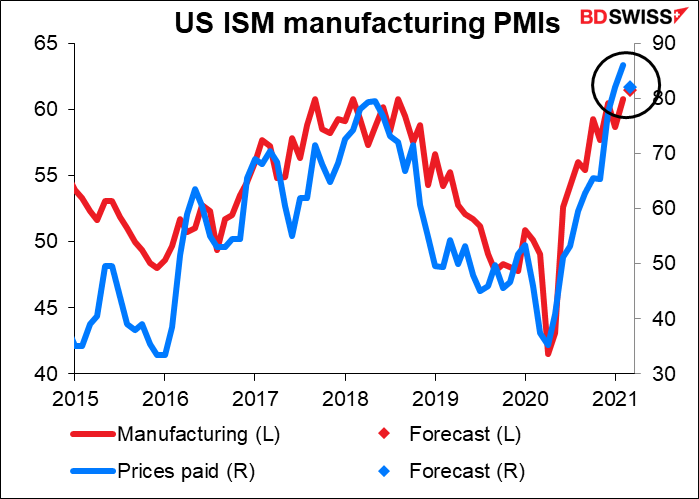
…because the US consumer price index has an alarming tendency to track the skyrocketing ISM manufacturing prices-paid index. Fortunately as we all know past performance is no guarantee of future performance or even contemporary performance and the peculiarities of today’s economy – massive backlogs in certain items and disruption to freight combined with high unemployment – mean that companies in many fields may not be able to pass the higher prices along to their customers.
