
 Earnings")
Introduction
American Express, Warren Buffet’s all time favorite stock within his Berkshire Hathaway fund has been showing steady results over many years. Not only is AXP a widely accepted credit card company on a global scale but it also has a sound business model behind it. In particular in the US, where the population is usually spending a lot of money for consumer goods, the business model has resumed strong traction after the Covid-19 pandemic. During the early days in 2020 the company has lost sharp momentum offering investors a cheap entry when the price has lost about 40% of its value. With the travel industry picking up steam thereafter, also the travel related business, a subsidiary of American Express, has picked up momentum as well.
Fundamental Data
With the increase in interest rates also came a higher profit margin for American Express. Despite spending in the US having shown growth in recent months, the general economy is also in sound shape. Compared to the Eurozone for example, official inflation is lower and thus, boosting expenditures.
The revenue during the last earnings report came in at USD 15.38 billion, which came in as estimated. The earnings per share came in at USD 3.30 and surprised markets by USD 0.35. Steady numbers and a normalization in inflation might support the current momentum further. The current expectation sits at USD 2.65 and might hence also offer room to the upside if the forecast is beaten.
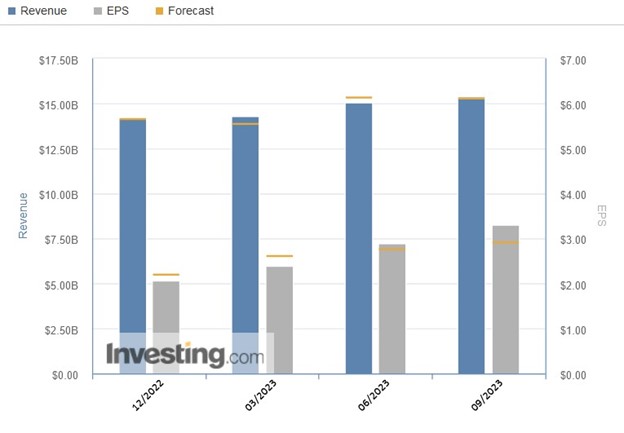
As the chart above shows the recent slight uptrend could continue and hence support the recent momentum. Earnings are expected to reach USD 16 billion, with earnings per share being at USD 2.64.
Technical levels
The price of American Express has faced a long sideways price pattern. After hitting a peak of about USD 135.00 just before the Covid- 19 pandemic the price of the company has weakened substantially. Ever since the positive trend resumed and the market has moved to new highs just below the USD 200.00 price range.
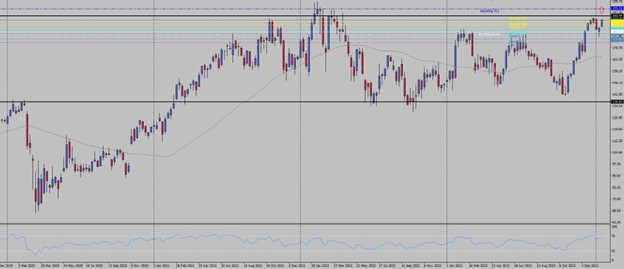
In the above weekly chart we can observe that the market is now using the USD 135.00 zone as an excellent support area. Worth noting also that the 50- moving average, which currently sits at about USD 165.00 is marking the center of the recent sideways channel. Currently the market is trading near their all-time- high and might offer positive chances to break to the upside. Any breakout beyond the USD 200.00 level could be seen as sharp positive momentum and based on a fibonacci extension offer upside potential towards the USD 230.00 area.
Sources:
https://www.tradingview.com


