


Rates as of 05:00 GMT
Market Recap
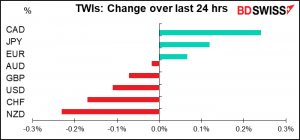
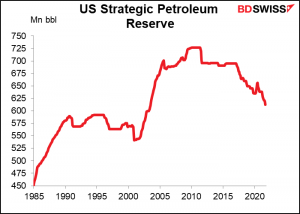
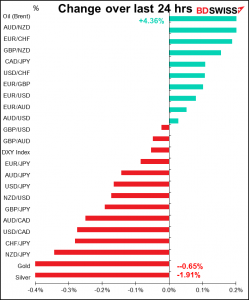
Not much action in currencies overnight but a lot in oil. Oil prices rose after US President Biden announced that the US would release 50mn barrels of oil from the Strategic Petroleum Reserve (SPR). Several other countries said they would release some oil too, although they seemed to be more token amounts than anything else ((1.5mn barrels for the UK, 5mn for India).
Why would oil prices rise on an increase in supply? Mostly because prices have fallen considerably ahead of the announcement in anticipation that the total released would be closer to 100mn barrels. So this figure was underwhelming.
Furthermore, it’s just smoke and mirrors. One-third of the US sale (18mn barrels) is just oil that was already planned & authorized to be released; it will be sold earlier than planned. The market had already discounted that. The bulk (32mn barrels) will be released “over several months.” Let’s say that’s three months. That would be 350,000 barrels a day, which is a drop in the barrel compared with domestic production of 11.4mn barrels a day. And this isn’t a sale – it’s a loan of oil that will have to be repaid by 2024.
The fact is, this is just theatre. President Biden’s popularity is sinking because of inflation and he has to be seen to be doing something to fight back.
The SPR peaked in 2010. The US has been selling oil from it since 2016. This is really nothing new.
Furthermore, Newton’s third law of motion is that every action has an equal and opposite reaction. In this case, the opposite reaction will be how OPEC+ reacts to the news. They’ve been planning on increasing their output by 400k barrels a day every month until they’re back up to their pre-pandemic levels. But they warned that if the US takes this action, they may reconsider that decision. 400k b/d is 12mn barrels a month. If they decide to pause or even just slow this increase, they could offset a lot of the increase in supply coming from the SPRs.
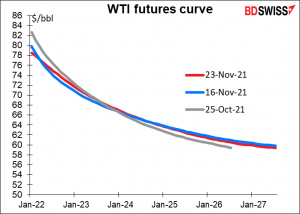
In short, I don’t think the release of oil from the SPR will have a lasting effect on oil prices. I’m still bullish in the short term. The fact that oil for near-term delivery is so much more expensive than oil out in the future shows that the market is very, very, tight right now.
Longer-term I’m worried that the resurgence of the virus and the reimposition of lockdowns could once again dampen movement and reduce demand for oil. This is what OPEC+ is worried about too. So we’ll have to see what happens in Europe.I don’t think it will ever get as bad as it was earlier this year or last year though, because I just can’t see the US going back into lockdown again. It’s just too politically dangerous with the balance of power in Washington so fragile and the President’s popularity on the ropes.
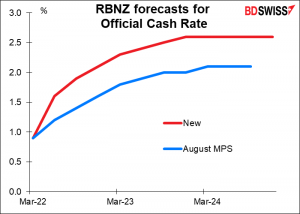
Separately, the Reserve Bank of New Zealand (RBNZ) raised rates 25 bps as expected but was more dovish than expected, saying it would take a cautious approach to further tightening. They did however raise their forecasts for the Official Cash Rate (OCR).
Today’s market
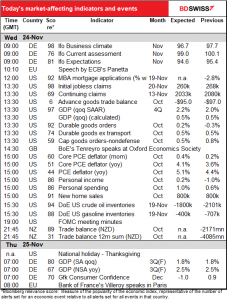
Note: The table above is updated before publication with the latest consensus forecasts. However, the text & charts are prepared ahead of time. Therefore there can be discrepancies between the forecasts given in the table above and in the text & charts.
Monday and Tuesday were quiet days, tomorrow will be desolate, but today…Today is a whole week of indicators crammed into one day. Will anyone be paying attention? As I remember, in New York the office largely emptied out by midday Wednesday as everyone headed for the airport to fly somewhere to be with family (or away from family, whichever the case.
Given the boatload of indicators, let’s first start with the two features: the PCE deflators and the FOMC minutes.
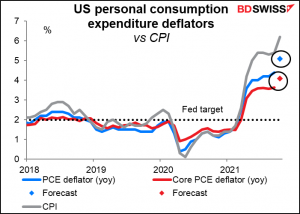
Then we come to the main indicator of the day: the US personal consumption expenditure (PCE) deflators. While these are not as well known nor as closely followed as the consumer price indices, they should be, because they’re the Fed’s preferred inflation gauge. When Fed officials talk about their 2% inflation target, this is what they’re talking about, not the CPI. (If you’re curious about the difference between the two, please see my report, PCE Deflator: the Little Indicator that should be Bigger)
Despite the differences between the two series, the PCE deflators are also expected to soar, although not by as much as the CPI did. That could reinforce the recent speculation that the Fed could accelerate its pace of tapering and start raising rates earlier than people think, which could be positive for the dollar.
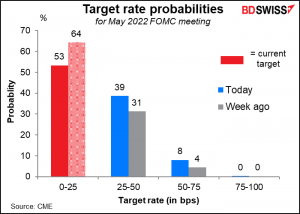
The market has been assuming June would be the earliest date for a rate hike, but after several voting members of the rate-setting Federal Open Market Committee (FOMC) Friday said that they were in favor of reducing their monthly bond purchases by more than the $15bn a month that they initially decided, speculation about a May hike has been increasing. It accelerated Monday after US President Biden reappointed Fed Chair Powell and made Gov. Brainard Vice Chair and in their acceptance speeches they both emphasized the fight against inflation – a key concern for the administration, which finds its popularity falling as prices rise. The reappointment Today’s PCE deflators could add to expectations of an earlier tightening, especially if they exceed the market consensus.
Later in the US business day, for those few souls still stuck in the office at 2 PM New York time, the Fed releases the minutes of the Nov. 3rd meeting of the FOMC. This was the meeting where they decided to taper down their $120bn-a-month bond purchases by $15bn a month (you can read the statement here). Usually what’s interesting in these minutes is to see the debate that went on. Since the decision to taper was unanimous, there might not have been many dissenting voices in the decision to illuminate in the minutes. Still, there might have been some differences on the pace of tapering and how long to wait after tapering before starting to hike rates – the fabled “lift-off.” Given the recent comments by several voting members that the higher-than-expected inflation requires faster-than-expected tapering, people will be looking for any discussion about what economic conditions might convince them to adjust the pace.
Now, as for the rest of the indicators…
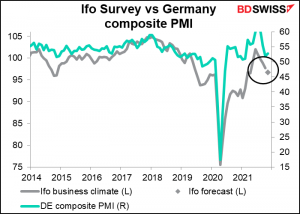
The day starts off with the Ifo survey. It’s expected to show some deterioration in sentiment and a deterioration in expectations, which would be reasonable considering how the pandemic is now at its worst-ever level in Germany.
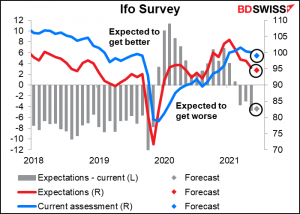
However Tuesday’s preliminary purchasing managers’ indices (PMIs) for Germany showed a surprising increase, so perhaps we’ll get a surprise here too.
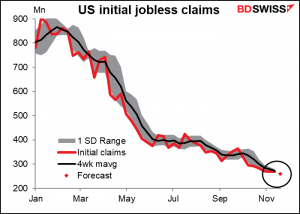
Next up are the storied US jobless claims, which are coming out today instead of Thursday as usual due to the holiday tomorrow. These include the dreaded initial jobless claims.
These may not be so dreaded anymore, though. The series we always look at is the seasonally adjusted data. The four-week moving average of jobless claims is considered to give a clearer picture of things. If we look at that, claims are still above the levels of the last few years.
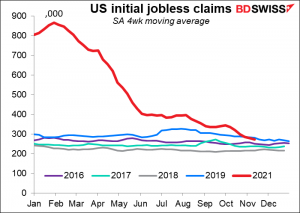
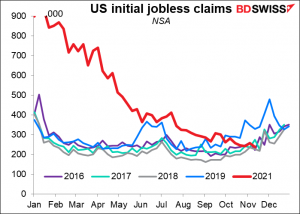
That might not be an accurate representation of the current situation today though because people’s behaviour has changed over the last year or two. That means the seasonal adjustments might not be accurate anymore. If we look at the unadjusted, raw data, initial jobless claims are actually at the bottom of the recent range for this time of year (even though the population has grown by 6.4mn people or 2.0% since 2016).
In any case, it looks like economists have decided to save money on their forecasts and reuse the forecasts that they used for the previous the two weeks – 260k. They can do this because the rate of decline has slowed precipitously. Last week initial claims only fell by 1k and the week before, 2k. So at this pace it’ll take four to eight more weeks for them to fall to 260k from 268k, although they are predicting it’ll happen.
Continuing claims have just come down to be within the range of previous years. This too is significant because it means the backlog of unemployed persons is getting absorbed, finally. Or maybe it just means that everyone has run out of unemployment insurance and will soon be on the street begging.
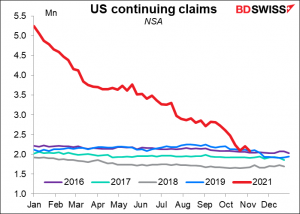
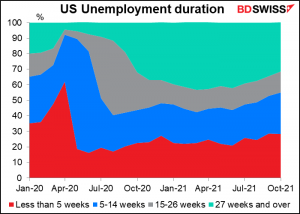
However looking at the breakdown of employment by duration, it seems that short-term unemployment is taking a larger share and the “27 weeks and over” people are shrinking. Great news!
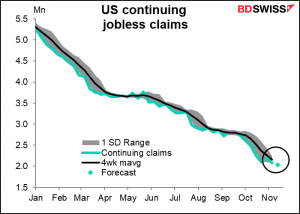
This week’s continuing claims are expected to continue declining but at about half the recent pace (-48k vs the four-week average of -100k a week). Probably as we get back into normal territory these figures will get less and less volatile.
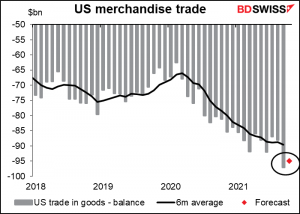
The US advance trade figures – the merchandise trade deficit, in simple terms – are expected to retreat a bit from last month’s record deficit. But no one will care about this today anyway.
The second estimate of US Q2 GDP would usually attract some attention, but I think the day before Thanksgiving, it would have to be revised considerably for anybody to care.
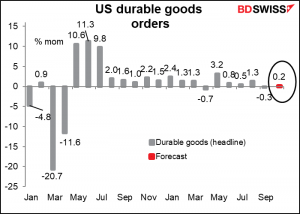
US durable goods orders on the other hand are always going to be worth a butcher’s. (That’s Cockney rhyming slang for “a look.” They’re expected to show a small rise after September’s small decline. That should reinforce the message we’ve gotten from the recent Fed surveys and the preliminary purchasing managers’ indices (PMIs) that the US economy continues to expand.
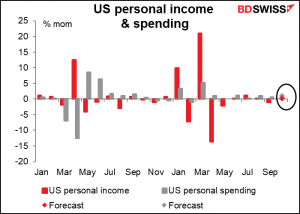
We’ve already discussed the PCE deflators. Along with the PCE deflators come the US personal income and spending figures. They’re both expected to rise, with spending expected to rise faster than income (maybe they’ve included my family in the survey?) Nevertheless, they’re both pretty healthy – incomes on this forecast would be about 8% above pre-pandemic levels, while spending would be about 10% above. That’s a big relief, because these figures cover October, the month after the special US pandemic unemployment payments ended. It was feared that the end of those payments would cut sharply into incomes and weigh heavily on spending, but apparently not – neither snow, nor rain, nor heat, nor gloom of night stays the US consumers from shopping.
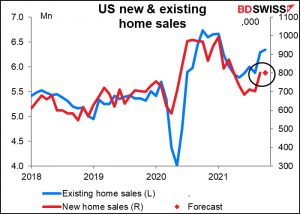
New home sales…Can you believe how many US indicators are coming out today? Existing home sales were expected to be down 1.7% mom but in the event were up 0.8%. New home sales are forecast to be unchanged. One might think that since existing home sales were up, new home sales are likely to be up too, but one would be mistaken. The two, move in the same direction precisely 50.4% of the time so it’s still a coin toss on a month-to-month basis.
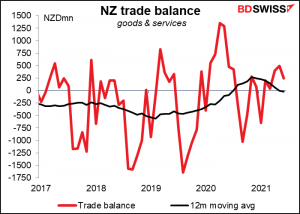
Overnight we get the New Zealand trade figures. They have a high Bloomberg relevance score but no one forecasts them any more. I present you with a graph just in case you want to eyeball the trend.

")
